
Code Profiling Utilities Manual

Code Profiling Usage Scenarios
HP Code Profiling Utilities Manual—542684-003
9-6
Generate the DPI File
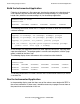
In this step, the elfdump executable that has just been built is run exactly as before
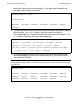
(two times, each with a different input). The following display shows the subvolume
after the two runs (the output files OUTPUT1 and OUTPUT2 have been purged).
Each of the two runs produced one of the two files beginning with ZZPF. These are the
raw data files that contain the profiling information from the two runs.
Generate the DPI File
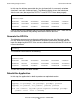
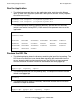
The following command runs profmrg to combine the two raw data files into a single
DPI file. Since no file paths are specified on the profmrg command, profmrg looks for
input files beginning with ZZPF in the current subvolume and creates the DPI file in the
current subvolume.
The subvolume now contains the following.
The DPI file PGODPI has been created.
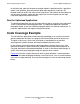
Rebuild the Application
In this step, the application is rebuilt to produce an optimized version.
$DATA05.TEST 6> files
$DATA05.TEST
ELFCOMH ELFDUMP ELFDUMPC ELFDUMPL ELFDUMPO LINKOUT
NSKELFH PLATDEPC PLATDEPH PLATDEPL PLATDEPO YOSELFC
YOSELFH YOSELFL YOSELFO ZZPF09VM ZZPFPFV8
profmrg
$DATA05.TEST 10> files
$DATA05.TEST
ELFCOMH ELFDUMP ELFDUMPC ELFDUMPL ELFDUMPO LINKOUT
NSKELFH PGODPI PLATDEPC PLATDEPH PLATDEPL PLATDEPO
YOSELFC YOSELFH YOSELFL YOSELFO ZZPF09VM ZZPFPFV8
cppcomp /in elfdumpc, out elfdumpl/ elfdumpo; profuse
cppcomp /in platdepc, out platdepl/ platdepo; profuse
cppcomp /in yoselfc, out yoselfl/ yoselfo; profuse
eld /out linkout/ $system.system.ccplmain elfdumpo platdepo
yoselfo -lcrtl -lcre -o elfdump