
Code Profiling Utilities Manual

Code Profiling Usage Scenarios
HP Code Profiling Utilities Manual—542684-003
9-10
Run the Application
Run the Application
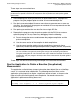
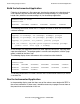
1. The following command lines run the application twice, each time with different
input. (In each case, $system.system.eld is the input file, but the -h and -p options
cause the runs to vary.)
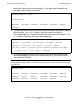
2. The following display shows the working directory, with the new raw data files
(which have names starting ZZPF). Each raw data file represents one run of the
application.
Produce the DPI File
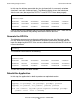
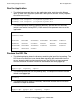
1. The following display shows the directory containing the input files for profmrg. The
SPI file and raw data files have already been moved to the workstation from the
server, where the build and test runs occurred. The SPI file has been renamed
from the Guardian file name PGOSPI to the Windows file name pgopti.spi.
2. The following command runs the profmrg utility. The output DPI file will have the
default name pgopti.dpi.
3. The following display shows the directory, which now includes the DPI file to be
submitted as input to codecov.
elfdump /out output1/ -h $system.system.eld
elfdump /out output2/ -p $system.system.eld
$DATAO5.TEST 2> files
$DATA05.TEST
ELFCOMH ELFDUMP ELFDUMPC ELFDUMPL ELFDUMPO LINKOUT
NSKELFH OUTPUT1 OUTPUT2 PGOSPI PGOSPL PLATDEPC
PLATDEPH PLATDEPL PLATDEPO YOSELFC YOSELFH YOSELFL
YOSELFO ZZPFO9UJ ZZPFU7
$ ls
pgopti.spi zzpfo9uj zzpfu7
profmrg
$ ls
pgopti.dpi pgopti.spi zzpfo9uj zzpfu7