
Code Profiling Utilities Manual


Code Profiling Usage Scenarios
HP Code Profiling Utilities Manual—542684-003
9-13
Evaluate the Code Coverage Report
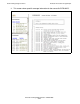
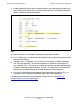
3. Scrolling down the right side of the detailed display, you see the source code, with
color coding to show what was covered and what was not. The following example
shows a portion of the detailed display:
Note:
•
Most of the lines are uncolored, meaning that they were executed.
•
The “2” below line 111 indicates that the procedure was called twice (once for each
execution of elfdump).
•
Looking at the if statement in line 118, the first assignment is yellow, indicating
that it was not executed. The second assignment is uncolored, indicating that it
was executed. The “^ 0” under line 119 indicates that line was executed zero times
(in neither execution of the procedure), and the “^ 2” under line 121 indicates that
that line was executed twice (once for each execution of the procedure).
•
Line 120 is yellow because the compiler did not generate any code for the else
statement, so that statement inherited its color from the preceding line.
For more information about how to interpret a display like this, see Section 8,
Interpreting the Code Coverage Report