
Debugging Dynamic Memory Usage Errors Using NonStop Native Inspect White Paper
50769 bytes allocated in 1011 blocks
No. Total bytes Blocks Address Function
0 49000 1000 0x08434cb0 main()
[...]
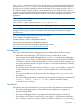
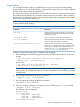
5. To view a specific allocation, specify the allocation number as an argument to the info
heap command.
For example:
(eInspect 0,105): info heap 1
4096 bytes at 0x7bd63000 (9.86% of all bytes allocated)
in h_func () at testc:108
in main () at testc:17
in _start ()
in $START$ ()
You can control the stack frames that are collected for reporting at any allocation point. For more
information on this feature, see ““Settings to Manage Performance Degradation”” (page 19)
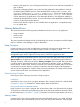
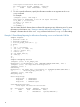
Example 1 illustrates the use of the info heap command with the min-heap-size filter setting.
Example 1 Filtered Heap Reporting for Allocations Exceeding <num> at a Particular Call-Site
Sample Program
1 #include <stdio.h>
2 #include <stdlib.h>
3 void set_brkpt_here(int i) { }
4 main()
5 {
6 int i, *arr[1000];
7 for (i=0; i < 1000; i++)
8 arr[i] = malloc (49);
9 malloc (30);
10 set_brkpt_here(0);
11 exit(0);
12
13 }
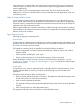
Sample Debugging Session
(eInspect 1,582): b set_brkpt_here
Breakpoint 2 at 0x70000a00:0: file \PELICAN.$DATA4.USER.EX1C, line 3.
(eInspect 1,582): set heap-check min-heap-size 31
(eInspect 1,582): c
Continuing.
Breakpoint 2, set_brkpt_here (i=138583280) at \PELICAN.$DATA4.USER.EX1C:3
* 3 void set_brkpt_here(int i) { }
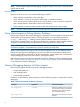
(eInspect 1,582): info heap
Analyzing heap ...
Actual Heap Usage:
Heap Start = 0x08001000
Heap End = 0x0843d000
Heap Size = 4440064 bytes
Outstanding Allocations:
50769 bytes allocated in 1011 blocks
No. Total bytes Blocks Address Function
0 49000 1000 0x08434cb0 main()
1 1024 1 0x08404560 <system/unknown>()
10