
Debugging Dynamic Memory Usage Errors Using NonStop Native Inspect White Paper


set heap-check block-size <num-bytes>
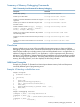
Example 2 Monitoring allocations greater than a specified size
Sample Program
1 #include <stdio.h>
2
3 int main()
4 {
5 char * cp;
6 printf("Start of the program\n");
7 cp = (char *)malloc(1024 *1024*10);
8 free (cp);
9 exit(0);
10 }
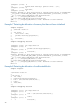
Sample Debugging Session
(eInspect 1,575): set heap-check on
(eInspect 1,575): set heap-check block-size 900000
(eInspect 1,575): b 9
Breakpoint 2 at 0x70000b00:1: file \PELICAN.$DATA4.USER.EX2C, line 9.
(eInspect 1,575): c
Continuing.
warning: Attempt to allocate a large object at 0x0842ad28
__rtc_event (ecode=RTC_HUGE_BLOCK, pointer=0x842ad28, pclist=0x0, size=0)
at c:\t1237\h0616\wdb\build\ia64-hp-nsk-native\
gdb\../../../Src/gnu/gdb\infrtc.c:1901
c:\t1237\h0616\wdb\build\ia64-hp-nsk-native\
gdb\../../../Src/gnu/gdb\infrtc.c:1901: Guardian or User Defined
Error 13
(eInspect 1,575): bt
#0 __rtc_event (ecode=RTC_HUGE_BLOCK, pointer=0x842ad28, pclist=0x0,
size=0)
at c:\t1237\h0616\wdb\build\ia64-hp-nsk-native\
gdb\../../../Src/gnu/gdb\infrtc.c:1901
#1 0x78008120:0 in rtc_record_malloc (pointer=0x842ad28 "", size=10485760,
heap_block=1, padded=1)
at c:\t1237\h0616\wdb\build\ia64-hp-nsk-native\
gdb\../../../Src/gnu/gdb\infrtc.c:3158
#2 0x7800ae60:0 in malloc (size=10485760)
at c:\t1237\h0616\wdb\build\ia64-hp-nsk-native\
gdb\../../../Src/gnu/gdb\infrtc.c:3912
#3 0x70000aa0:0 in main () at \PELICAN.$DATA4.USER.EX2C:7
#4 0x70000cc0:0 in _MAIN () at \SPEEDY.$RLSE.T8432H02.CPLMAINC:46
(eInspect 1,575): c
Continuing.
Breakpoint 2, main () at \PELICAN.$DATA4.USER.EX2C:9
* 9 exit(0);
Monitoring De-allocations to Detect Double-Frees
The set heap-check free <on/off> command enables you to detect double-frees and frees
with improper arguments. When this command is enabled, the free() calls are monitored to
verify whether the parameters address valid heap blocks. If an erroneous free() is detected, the
debugger stops execution and reports the error. You can analyze the stack trace to analyze where
and how the error occurred.
“Example 6” (page 19) illustrates the use of the set heap-check free command.
Monitoring Heap Corruption
Native Inspect enables you to detect the presence of heap-corruption in your application.
Memory-Debugging Features of Native Inspect 13