
Debugging Dynamic Memory Usage Errors Using NonStop Native Inspect White Paper


7 strcpy(cp,"Hello");
8 cp[100] = 100;
9 free(cp);
10 exit(0);
11 }
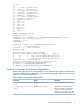
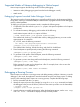
Sample Debugging Session
(eInspect 1,558): set heap-check bounds on
(eInspect 1,558): b 10
Breakpoint 2 at 0x70000c10:1: file \PELICAN.$DATA4.USER.EX4C, line 10.
(eInspect 1,558): c
Continuing.
warning: Memory block (size = 100 address = 0x08429cf8) appears to be
corrupted at the beginning.
Allocation context might not be correct.
#1 main() at \PELICAN.$DATA4.USER.EX4C:5
#2 _MAIN() at \SPEEDY.$RLSE.T8432H02.CPLMAINC:46
warning: Use command backtrace (bt) to see the current context.
Ignore top 4 frames belonging to leak detection library of eInspect.
__rtc_event (ecode=RTC_BAD_HEADER, pointer=0x8429cf8, pclist=0x8404a38,
size=100)
at c:\t1237\h0616\wdb\build\ia64-hp-nsk-native\
gdb\../../../Src/gnu/gdb\infrtc.c:1901
c:\t1237\h0616\wdb\build\ia64-hp-nsk-native\
gdb\../../../Src/gnu/gdb\infrtc.c:1901: Guardian or User Defined
Error 13
(eInspect 1,558): c
Continuing.
Breakpoint 2, main () at \PELICAN.$DATA4.USER.EX4C:10
* 10 exit(0);
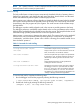
The size of guard bytes for every block of the allocated memory is currently set to 8 leading (header)
bytes and 1 tail (footer) byte. These guard bytes are used to detect boundary (buffer over-run and
buffer under-run) memory corruptions.
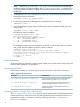
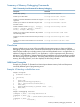
Detecting Heap Corruption
The info corruption <filename> command enables you to view the corruption profile of
all the allocations that are corrupted at a specified probe-point in the program. Ensure that the
bounds checking is enabled before using the info corruption command. The corruption
information is written to a specified file if the <filename> is provided. Otherwise, it is written to
stdout.
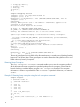
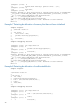
Example 5 Detecting heap corruption using the info corruption command
Sample Program
1 #include <stdio.h>
2 #include <stdlib.h>
3
4 char *t;
5 char *t1;
6 char *t2;
7 char *t3;
8
9 char * sm_malloc(sz)
10 int sz;
11 {
12 return (char *)malloc(sz); /* line number 12 */
13 }
14
16