
Debugging Dynamic Memory Usage Errors Using NonStop Native Inspect White Paper


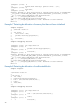

15 main()
16 {
17 t = (char *)sm_malloc(10);
18 strcpy(t, "123456789123");
19 t1 = (char *)sm_malloc(10);
20 strcpy(t1, "12345678912");
21 t2 = (char *)sm_malloc(10);
22 strcpy(t2, "1234567891");
23 t3 = (char *)sm_malloc(10);
24 strcpy(t3, "123456789");
25 printf("Hello\n");
26 free (t);
27 free (t1);
28 free (t2);
29 free (t3);
30 free (t);
31 free (t1);
32 exit(1);
33 }
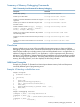
Sample Debugging Session
(eInspect 1,666): b 25
Breakpoint 2 at 0x70000e00:1: file \PELICAN.$DATA4.USER.EX5C, line 25.
(eInspect 1,666): set heap-check on
(eInspect 1,666): c
Continuing.
Breakpoint 2, main () at \PELICAN.$DATA4.USER.EX5C:25
* 25 printf("Hello\n");
(eInspect 1,666): info corruption
Analyzing heap ...
Following blocks appear to be corrupted
No. Total bytes Blocks Corruption Address Function
0 10 1 End of block 0x08429cf8 sm_malloc()
1 10 1 End of block 0x08429d18 sm_malloc()
2 10 1 End of block 0x08429d38 sm_malloc()
(eInspect 1,666): info corruption 2
10 bytes at 0x08429d38 (33.33% of all bytes allocated)
#0 sm_malloc() at \PELICAN.$DATA4.USER.EX5C:12
#1 main() at \PELICAN.$DATA4.USER.EX5C:21
#2 _MAIN() at \SPEEDY.$RLSE.T8432H02.CPLMAINC:46
Settings to Manage Performance Degradation
Memory-debugging slows down the performance of an application by roughly 2-3 times because
of stack unwinding. Reducing the number of stack frames the debugger collects for each allocation
reduces the performance degradation.
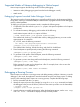
Table 6 Options for Performance Improvement
DescriptionSettingCommand
Controls the depth of the call stack.By default, num is set to 4set heap-check frame-count
<num>
Specifies the minimum leak size for
stack trace collection. The debugger
By default, num is set to 0.set heap-check min-leak-size
<num>
continues to report leaks that are
smaller than <num> bytes, but it does
not provide the stack trace for the same.
Settings to Manage Performance Degradation 17