
Debugging Dynamic Memory Usage Errors Using NonStop Native Inspect White Paper


Supported Modes of Memory-debugging in Native Inspect
Native Inspect supports the following modes of memory-debugging:
• Interactive mode (debugging programs launched under debugger control)
• Attach mode
Debugging Programs Launched Under Debugger Control
The interactive mode of memory-debugging is typically useful during the development and defect
fixing phase, where you need the flexibility to control the flow of program execution while debugging
memory related problems.
To debug your program in the interactive mode, complete the following steps:
1. Compile the source files with the symbols or -g option. No special compilation or link options
are required.
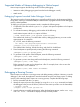
2. To activate the memory debugging, perform either of the following:
Invoke Native Inspect with the lib option as follows:
> rund <executable> /lib $system.sys00.zrtcdll/
This enables leak checking. To enable other memory debugging features, you must use the
appropriate set of commands.
Or, on OSS, enter the following command:
: run –debug –lib=/G/system/sys00/zrtcdll <executable>
(eInspect 0,105):set heap-check on
This enables leaks checking, bounds checking, and check for double-frees.
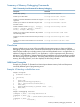
3. Place breakpoints at probe points by entering the following command:
(eInspect 0,105):b <probe_point>
4. To generate a leak profile at the breakpoint, enter the following command:
(eInspect 0,105):info leaks
5. To generate a point-in-time heap profile at the breakpoint, enter the following command:
(eInspect 0,105): info heap
Either command’s output may be logged into a file. For example, here is how to save the
output from the leaks command:
(eInspect 0,105):info leaks <filename>
Debugging a Running Process
Native Inspect can attach to a running process and debug memory problems. However, to use the
debugger in this mode, the application must be launched using the user library option. To debug
memory while attaching Native Inspect to a running process, complete the following steps:
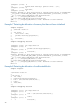
1. Run the executable with the lib option.
2. Identify the required process (for example, by using the status or ps command) and attach
the debugger to the process as follows (where N is the same cpu used to run the executable).
> einspect /cpu N/
(einspect 0,105) attach <process-id>
3. Insert breakpoints at suitable probe-points. When the breakpoints trigger, use the info heap
and info leaks commands to display the heap and leak profile.
18