
Debugging Dynamic Memory Usage Errors Using NonStop Native Inspect White Paper


Summary of Memory Debugging Commands
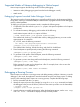
Table 7 Commonly Used Commands for Memory Debugging
CommandDescription
set heap-check <on/off>Enables heap profiling
set heap-check leaks <on/off>Enables you to detect leaks
set heap-check free <on/off>Enables you to detect double-frees and frees with improper
arguments
set heap-check bounds <on/off>Enables you to check for out-of-bounds corruption when
the block is freed
set heap-check string <on/off>Enables validation of calls to strcpy(), strncpy(),
memcpy(), memccpy(),memset(), memmove(),
bzero(), strdup(), and, bcopy()
set heap-check frame-count <num>Enables you to set the number of frames to be printed for
leak and heap profiles
set heap-check min-heap-size <num>Enables you to set the minimum block size to report in heap
profiles
set heap-check min-leak-size <num>Enables you to set the minimum block size to use for leak
detection
Conclusion
Memory-related errors are some of the most difficult programming errors to detect and debug.
Debugging memory-related errors is difficult without the help of an effective memory analysis tool.
Native Inspect enables you to debug memory leaks and heap-related errors in an application. In
addition to plugging memory leaks in your application, it is also important to track the memory
utilization in your application. Native Inspect provides capabilities such as heap profiling to analyze
the memory-usage of your application. The heap profile displays information about the allocated
memory, the calling function, and it also displays the allocating call stack.
Additional Examples
Example 6 to Example 11 illustrate how Native Inspect detects memory leaks and heap-errors
caused by different types of programming errors.
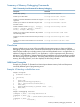
Example 6 Detecting a double-free error
Sample Program
1 #include <stdio.h>
2
3 int main()
4 {
5 char* han;
6 printf("Starting program\n");
7 han = (char*)malloc(sizeof(char));
8 free(han);
9 printf("Now freeing a pointer twice...\n");
10 free(han);
11 }}
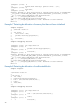
Sample Debugging Session
(eInspect 1,1180): set heap-check free on
(eInspect 1,1180): n
* 7 han = (char*)malloc(sizeof(char));
(eInspect 1,1180): n
* 8 free(han);
Summary of Memory Debugging Commands 19