
Debugging Dynamic Memory Usage Errors Using NonStop Native Inspect White Paper

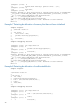


(eInspect 1,677): n
warning: Attempt to free unallocated or already freed object at 0x0842ad2c
__rtc_event (ecode=RTC_BAD_FREE, pointer=0x842ad2c, pclist=0x0, size=0)
at c:\t1237\h0616\wdb\build\ia64-hp-nsk-native\
gdb\../../../Src/gnu/gdb\infrtc.c:1901
c:\t1237\h0616\wdb\build\ia64-hp-nsk-native\
gdb\../../../Src/gnu/gdb\infrtc.c:1901: Guardian or User Defined
Error 13
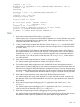
Example 9 Detecting memory leaks caused when an application overwrites a pointer
that currently addresses a block of memory with another address or data
Sample Program
1 #include <stdio.h>
2
3 int main() {
4 int* han1, * han2;
5 printf("Starting program\n");
6 han1 = (int*)malloc(sizeof(int));
7 han2 = (int*)malloc(sizeof(int));
8 han1 = han2;
9 free(han1);
10 }
Sample Debugging Session
(eInspect 1,699): set heap-check on
(eInspect 1,699): n
* 6 han1 = (int*)malloc(sizeof(int));
(eInspect 1,699): n
* 7 han2 = (int*)malloc(sizeof(int));
(eInspect 1,699): n
* 8 han1 = han2;
(eInspect 1,699): n
* 9 free(han1);
(eInspect 1,699): n
* 10 }
(eInspect 1,699): info leak
Scanning for memory leaks...
4 bytes leaked in 1 blocks
No. Total bytes Blocks Address Function
0 4 1 0x0842ad28 main()
(eInspect 1,699): info leak 0
4 bytes leaked at 0x0842ad28 (100.00% of all bytes leaked)
#0 main() at \PELICAN.$DATA4.USER.EX9C:6
#1 _MAIN() at \SPEEDY.$RLSE.T8432H02.CPLMAINC:46
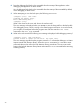
Example 10 Detecting memory leaks that are caused when a pointer variable in an
application addresses memory that is out of the scope of the application
Sample Program
1 #include <stdio.h>
2
3 void func1(int* ptr1)
4 {
5 ptr1 = (int*)malloc(5*sizeof(int));
6 }
7
8 void func2(int** ptr)
Additional Examples 21