
Debugging Dynamic Memory Usage Errors Using NonStop Native Inspect White Paper

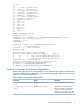
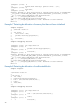


(eInspect 1,712): b 17
Breakpoint 2 at 0x70000b60:1: file \PELICAN.$DATA4.USER.EX11C, line 17.
(eInspect 1,712): c
Continuing.
Breakpoint 2, main () at \PELICAN.$DATA4.USER.EX11C:17
* 17 }
(eInspect 1,712): info leak
Scanning for memory leaks...
50 bytes leaked in 1 blocks
No. Total bytes Blocks Address Function
0 50 1 0x08429d18 main()
(eInspect 1,712): info leak 0
50 bytes leaked at 0x08429d18 (100.00% of all bytes leaked)
#0 main() at \PELICAN.$DATA4.USER.EX11C:13
#1 _MAIN() at \SPEEDY.$RLSE.T8432H02.CPLMAINC:46
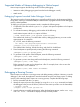
FAQ
1. Does Native Inspect report all the leaks in a program?
Native Inspect uses a conservative leak detection algorithm. As a result, all leaks may not be
reported, but all reported leaks are definite leaks. Native Inspect reports leaks only in the
code path exercised in the current run.
2. I wrote a small sample program that allocates a block using malloc() and leaks the block
immediately, by assigning NULL to the pointer, but Native Inspect does not report this block
as a leak. Why?
This is attributed to the leak detection algorithm followed by Native Inspect. If the datum in
the program address space masks a leak, the leak is not reported. In this case the address
returned from malloc() is stored in the architecture registers and consequently masks the
leak. Typically, if you call any function after the leak, such as a printf(), Native Inspect
can catch the leak.
3. Does Native Inspect support detection of leaks in third-party code?
Yes. Native Inspect supports detection of leaks in third-party code also.
4. Can Native Inspect debug applications with user-defined memory management routines?
Native Inspect can debug applications with memory management routines that are either user
defined or are wrappers to the default memory management routines. However, the granularity
of tracing memory failures may be reduced to only the sections of memory allocated through
malloc(). Other smaller blocks allocated within this region will not be memory checked.
5. Does Native Inspect report the exact instant when the block becomes a leak?
No. Native Inspect does not provide information on when the leak occurred. It reports only
the allocation stack trace of the leaked block and does not report the stack trace where the
block leaked.
6. Does Native Inspect support debugging of C++ applications with calls to new() and
delete()?
Yes. Native Inspect supports debugging of C++ applications with new() and delete()
calls, but only if they internally call malloc()and free().
7. Does Native Inspect support memory-debugging of long running applications?
Yes. Native Inspect supports debugging of long running applications as long as the memory
leak detection library has been specified as an option when the application starts.
FAQ 23