EPTRACE Manual Abstract EPTRACE is an H-series performance investigation tool for the OSS and Guardian environments. It is designed to count, trace, locate, and provide a log of performance related trap events that occur during program execution. Product Version H01 Supported Release Version Updates (RVUs) This manual supports H06.03 and all subsequent H-series RVUs until otherwise indicated by its replacement publication.
Document History Part Number Product Version Published 528811-001 H01 November 2004 528811-002 H01 July 2005
EPTRACE Manual Glossary Index What’s New in This Manual iii Manual Information iii New and Changed Information About This Manual v Related Manuals v Notation Conventions iii v 1. Introducing EPTRACE Performance Considerations 1-1 2. Using EPTRACE Before Running an EPTRACE Session 2-1 Running an EPTRACE Session 2-1 EPTRACE Usage Considerations 2-1 Sample EPTRACE Session Sample 2-2 Analyzing EPTRACE Data 2-2 3.
Glossary Contents VOLUME 3-10 Glossary Index EPTRACE Manual— 528811-002 ii
What’s New in This Manual Manual Information EPTRACE Manual Abstract EPTRACE is an H-series performance investigation tool for the OSS and Guardian environments. It is designed to count, trace, locate, and provide a log of millicode corrected misalignment and TNS stumble events. Product Version H01 Supported Release Version Updates (RVUs) This manual supports H06.03 and all subsequent H-series RVUs until otherwise indicated by its replacement publication.
About This Manual EPTRACE is an H-series performance investigation tool for the OSS and Guardian environments. It is designed to count, trace, locate, and provide a log of millicode corrected misalignment events in TNS stumble events. This user’s guide introduces software developers to EPTRACE and its command set. The following sections provide reference and task information about this product: 1. Section 1, Introducing EPTRACE 2. Section 2, Using EPTRACE 3.
Notation for Messages About This Manual italic computer type. Italic computer type letters within text indicate variable items that you supply. Items not enclosed in brackets are required. For example: pathname [ ] Brackets. Brackets enclose optional syntax items. For example: TERM [\system-name.]$terminal-name INT[ERRUPTS] A group of items enclosed in brackets is a list from which you can choose one item or none.
Notation for Messages About This Manual The user must press the Return key after typing the input. Nonitalic text. Nonitalic letters, numbers, and punctuation indicate text that is displayed or returned exactly as shown. For example: Backup Up. lowercase italic letters. Lowercase italic letters indicate variable items whose values are displayed or returned. For example: p-register process-name [ ] Brackets. Brackets enclose items that are sometimes, but not always, displayed.
1 Introducing EPTRACE EPTRACE is a performance investigation tool designed for the Guardian and OSS environments. It reports detailed counts of performance related trap events and provides a trace log of these events so you can locate, diagnose, and resolve trapcausing locations in a program. EPTRACE reports two types of information in the trace log: • Counters Reports individual counters for each process, including interrupt processes. The per-CPU totals equal the sum of all process counters.
2 Using EPTRACE EPTRACE allows you to determine the frequency and locations of compatibility traps and transitions. Using this information you can resolve these problems and improve the performance of your application code. Before Running an EPTRACE Session • • • Use a separate TACL prompt and EPTRACE session for each traced CPU.
EPTRACE Usage Considerations Using EPTRACE EPTRACE Usage Considerations • • • • Separate multiple commands on the command line using a semicolon. You can use comments on the command line. Any text after the “--” is a comment. You may split a command line entry over multiple lines by entering the continuation character “\” before pressing the return key at the end of each intermediate line. EPTRACE may need to display tracing information that exceeds 23 lines.
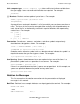
Locating problematic source lines Using EPTRACE Assume that EPTRACE has reported a problem in file $system.sys30.eptrace at address 0x7001f2e0. In this example, eNoft shows that the address resolves to source line 969.000 in the file SEPTREEC in (C++ mangled) procedure upgradePinTrace. \HALF3.$SYSTEM.STARTUP 1> enoft enoft> file $system.sys30.eptrace Object File: $system.sys30.
3 EPTRACE Command Summary This section describes EPTRACE command syntax in alphabetical order. • • • • • • • • • • • • • BUFFER on page 3-1 CD on page 3-1 CLEAR on page 3-2 ENV on page 3-2 EXIT on page 3-2 HELP on page 3-3 INFO on page 3-3 LOG on page 3-3 OBEY on page 3-4 SHOW on page 3-4 START on page 3-8 STOP on page 3-9 VOLUME on page 3-11 BUFFER Use BUFFER to specify the maximum number of trace entries EPTRACE should report about a program.
CLEAR EPTRACE Command Summary path is either the fully qualified OSS path or an OSS path relative to the current OSS path. CLEAR The CLEAR command resets the trace buffer and time trace fields to zero. CLEAR [item] item is one of: • PIN nnn events that occur in process number nnn in the current CPU. • PROGRAM ppp is the program name for which EPTRACE is reporting events. The program name is relative to the current directory of the executable (Guardian or OSS).
HELP EPTRACE Command Summary HELP The HELP command displays help information about one or more EPTRACE commands. If you do not specify an EPTRACE command, help information is displayed for all EPTRACE commands. HELP [topic] topic is the name of an EPTRACE command. INFO The INFO command displays information about trace commands you have already started. You can filter this information by process number in the current CPU, by program name, or by both process number and program name.
OBEY EPTRACE Command Summary file is a Guardian file name relative to the current Guardian default volume. file can also be a fully qualified Guardian path. If the file name already exists, EPTRACE overwrites the existing file. OBEY The OBEY command invokes EPTRACE commands from an edit file. OBEY [filename] [QUIET] filename is the name of a command file in EDIT format (mode 101) that contains EPTRACE commands. EPTRACE reads the obey file until it detects the end-of-file or encounters an error.
SHOW Usage Considerations EPTRACE Command Summary events that occur in process number nnn in the current CPU. • PROGRAM ppp is the program name for which EPTRACE is reporting events. The program name is relative to the current directory of the executable (Guardian or OSS). • ALL displays all events that occur in a process number or program name for the monitored CPU, including interrupt processes.
SHOW Command Example EPTRACE Command Summary before a START command, EPTRACE computes the rate per second from the start of the EPTRACE session. • • When there are more entries than EPTRACE can maintain, the trace buffer wraps and displays the latest entries. You can prevent wrapping by using one or more of these suggestions and then rerunning EPTRACE.
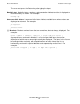
SHOW Command Example EPTRACE Command Summary • This example displays the SHOW PIN command output when tracing is enabled. Numbers are displayed in their natural base (native addresses in hexadecimal, CISC (TNS) addresses in octal, and “ordinary” counters in decimal. show: This trace started at 7:38:40.52 on 22 April 2005 and is still running at 7:38:54.04 on 22 April 2005 on CPU 0 Trace duration is 0:0:0:13.52 Total number of traced events 846 (62.
START EPTRACE Command Summary 1 Mode Valid values are: • • • 2 Code Space ACC - accelerated code INT - interpreted code NAT - native code Valid values are: • • • • • • 3 Level CISC UC - TNS code in the user space CISC Pub - TNS public libraries NAT UC - native user code, including private libraries PUB - native public DLL code IMP - implicit DLL code Other - any other code or libraries Valid values are: • • 4 Type User - Code is running in non-privileged mode PrivK - Code is running with kernel p
STOP EPTRACE Command Summary item is one of: • PIN nnn events that occur in process number nnn in the current CPU. • PROGRAM ppp is the program name for which EPTRACE is reporting events. The program name is relative to the current directory of the executable (Guardian or OSS). • ALL displays all events that occur in a process number or program name for the monitored CPU.
STOP EPTRACE Command Summary • • references to relative segments 2 or 3 unexpected transitions out of accelerated code STOP [item [event list] ] item is one of: • PIN nnn events that occur in process number nnn in the current CPU. • PROGRAM ppp is the program name for which EPTRACE is reporting events. The program name is relative to the current directory of the executable (Guardian or OSS). • ALL displays all events that occur in a process number or program name for the monitored CPU.
VOLUME EPTRACE Command Summary VOLUME The VOLUME command specifies the current Guardian default sub-volume for Guardian programs that EPTRACE should trace events for. VOLUME [path] path is a fully qualified Guardian path on the same node as the traced CPU. It can also be the Guardian path relative to the current Guardian path. If the path is left blank, EPTRACE reverts to the volume used when the EPTRACE session was first started.
Glossary absolute pathname. An Open System Services (OSS) pathname that begins with a slash (/) character and is resolved beginning with the root directory. Contrast with relative pathname. accelerate. To speed up emulated execution of a TNS object file by applying the Accelerator for TNS/R system execution or the Object Code Accelerator (OCA) for TNS/E system execution before running the object file. accelerated mode. See TNS accelerated mode. accelerated object code.
code file Glossary code file. See object code file. code segment. A segment that contains executable instructions of a program or library to be executed plus related information. Code segments can be executed and also accessed as read-only data but not written to by an application program. These readonly and execute-only segments are efficiently shared among simultaneous executions of that program or library. Therefore, they are read from disk but are never written back to disk. See also TNS code space.
download Glossary download. The process of transferring software from one location to another, where the transferring entity initiates the transfer. EDIT file. In the Guardian file system, an unstructured file with file code 101. An EDIT file can be processed by either the EDIT or PS Text Edit (TEDIT) editor. An EDIT file typically contains source program or script code, documentation, or program output. Open System Services (OSS) functions can open an EDIT file only for reading. EPTRACE.
filename Glossary filename. In the Open System Services (OSS) environment, a component of a pathname containing any valid characters other than slash (/) or null. See also file name. file name. A string of characters that uniquely identifies a file. In the PC environment, file names for disk files normally have at least two parts (the disk name and the file name); for example, B:MYFILE.
Guardian services Glossary Guardian services. An application program interface (API) to the HP NonStop™ operating system, plus the tools and utilities associated with that API. This term is synonymous with Guardian environment. See also Guardian. Guardian user ID. See HP NonStop™ operating system user ID. header.
implicit library Glossary implicit library. A library supplied by HP that is available in the read-only and execute-only globally mapped address space shared by all processes without being specified to the linker or loader. See also TNS system library. implied user library. A method of binding TNS object files that have more than 16 code segments. Segments 16 through 31 are located in the user code (UC) space but are executed as if they were segments 0 through 15 of the user library (UL) code space.
library client Glossary it can be a system-managed collection of preloaded routines. Source-code libraries fall outside the scope of this glossary. library client. A program or another library that uses routines or variables from that library. library file. See library. linking. The operation of collecting, connecting, and relocating code and data blocks from one or more separately compiled object files to produce a target object file. load.
native Glossary native. An adjective that can modify object code, object file, process, procedure, and mode of process execution. Native object files contain native object code, which directly uses MIPS or Intel® Itanium® instructions and the corresponding conventions for register handling and procedure calls. Native processes are those created by executing native object files. Native procedures are units of native object code.
OCA region loading Glossary OCA region loading. A task performed when necessary by the TNS emulation software for TNS/E machines. This task involves mapping into memory the Intel® Itanium® instructions and any tables needed at run time from the TNS Object Code Accelerator (OCA) region (called the Itanium instruction region) of an OCA-generated object file. OCA region of an object file.
OSS Glossary OSS. See Open System Services (OSS). OSS environment. See Open System Services (OSS) environment. OSS process ID. In the Open System Services (OSS) environment, the unique identifier that identifies a process during the lifetime of the process and during the lifetime of the process group of that process. OSS user ID. See HP NonStop™ operating system user ID. pathname.
program Glossary program. See program file. program file. An executable object code file containing a program’s main routine plus related routines statically linked together and combined into the same object file. Other routines shared with other programs might be located in separately loaded libraries. A program file can be named on a RUN command; other code files cannot. See also object code file. pTAL. Portable Transaction Application Language.
shared memory Glossary Servers are designed to receive request messages from clients or requesters; perform the desired operations, such as database inquiries or updates, security verifications, numerical calculations, or data routing to other computer systems; and return reply messages to the clients or requesters. A server process is a running instance of a server program. shared memory. An interprocess communication mechanism that allows two or more processes to share a given region of memory.
SYSnn subvolume Glossary SYSnn subvolume. A subvolume on the $SYSTEM volume where the new version of the HP NonStop™ operating system image is located. Also located on the SYSnn subvolume is system-dependent and release version update (RVU)-dependent software. nn is an octal number in the range %00 through %77. system.
TNS C compiler Glossary translated into optimized sequences of MIPS or Intel® Itanium® instructions. TNS accelerated mode runs much faster than TNS interpreted mode. Accelerated or interpreted TNS object code cannot be mixed with or called by native mode object code. See also TNS Object Code Accelerator (OCA). Contrast with TNS/E native mode. TNS C compiler. The C compiler that generates TNS object files. Contrast with TNS/E native compiler. TNS code segment.
TNS interpreted mode Glossary TNS interpreted mode. A TNS emulation environment on a TNS/E system in which individual TNS instructions in a TNS object file are directly executed by interpretation rather than permanently translated Intel® Itanium® instructions. TNS interpreted mode runs slower than TNS accelerated mode. Each TNS instruction is decoded each time it is executed, and no optimizations between TNS instructions are possible.
TNS stack segment Glossary A TNS process temporarily executes in native mode when calling into native-compiled parts of the system library. Object files within a TNS process might be accelerated or not, with automatic switching between accelerated and interpreted modes on calls and returns between those parts. Contrast with TNS/E native process. TNS stack segment. See TNS user data segment. TNS State Library for TNS/E.
TNS/E native object file Glossary TNS/E native object file. An object file created by a TNS/E native compiler that contains Intel® Itanium® instructions and other information needed to construct the code spaces and the initial data for a TNS/E native process. TNS/E native process. A process initiated by executing a TNS/E native object file. Contrast with TNS process. TNS/E native signal. A signal model available to TNS/E native processes in both the Guardian and Open System Services (OSS) environments.
word Glossary word. An instruction-set-defined unit of memory that corresponds to the width of registers and to the most common and efficient size of memory operations. A TNS word is 2 bytes (16 bits) wide, beginning on any 2-byte boundary in memory. An Intel® Itanium® word is also 4 bytes (32 bits) wide, beginning on any 4-byte boundary in memory.
Content Feedback First Name: __________________ Phone: _____________________ Company: ___________________ Last Name: _________________ e-mail address: ______________ (All contact information fields are required.) If you’re reporting an error or omission, is your issue: Minor: I can continue to work, but eventual resolution is requested. Major: I can continue to work, but prompt resolution is requested. Critical: I cannot continue to work without immediate response.
Index A Analyzing EPTRACE data 2-2 B Before running and EPTRACE session 2-1 BUFFER 3-1 Buffer size decrease 3-1 increase 3-1 C CD 3-1 CLEAR 3-2 Clear counters 3-2 time trace fields 3-2 trace buffer 3-2 Close active log files 3-2 tracing 3-2 D Data analysis 2-2 Discard counters 3-2 dynamically allocated trace buffers 3-2 Display event information 3-4 Documentation roadmap -i E EPTRACE analyzing data 2-2 event resolution 2-2 introduction 1-1 overview 1-1 performance considerations 1-1 pre-session conside
F Index F fetch and store operation problems 3-5, 3-9, 3-10 H Resolving EPTRACE events 2-2 Running an EPTRACE session 2-1 S native misalignment events 3-8, 3-10 Sample EPTRACE session 2-2 Set current Guardian default subvolume 3-11 Set current OSS directory location 3-1 SHOW 3-4 SHOW command usage considerations 3-5 START 3-8 Start logging to a file 3-3 start 3-8 Start tracing events 3-8 STOP 3-9 Stop counters 3-2 logging to a file 3-3 tracing 3-2 stop 3-9 Stop tracing events 3-9 O T OBEY 3-4 Tra
V Index V VOLUME 3-11 EPTRACE Manual— 528811-002 Index -3
V Index EPTRACE Manual— 528811-002 Index -4