
H-Series Application Migration Guide (H06.03+)

The TNS/E Native Development Environment
H-Series Application Migration Guide—429855-006
2-11
TNS/E Native Mode Debugging Tools
intended as a replacement for the G-series Debug facility and the G-series Inspect
debugger for native mode debugging. The command name for Native Inspect is
eInspect.
Native Inspect provides most of the functionality of Inspect and Debug. However, the
Native Inspect command syntax differs from that of Inspect and Debug. The Native
Inspect syntax is based on the Open Software Foundation GDB debugger, a tool that is
widely used throughout the industry and is familiar to many application developers. In
most cases, you are encouraged to use Visual Inspect as your primary application
debugger. The primary advantage of Native Inspect is that it provides enhanced
scripting support in the form of the Tool Command Language (TCL), a widely used
scripting language, which enables you to automate many of your debugging tasks.
Note that any Inspect command files you are currently using to automate debugging
operations must be converted to Native Inspect syntax.
Native Inspect supports the debugging of PIC (all TNS/E native code is PIC), whereas
Inspect on the TNS/R platform cannot be used with PIC.
See the Native Inspect Manual for details. Table 2-4 and Table 2-5 show Inspect
commands and their Native Inspect equivalents. Table 2-4 shows the low-level Inspect
commands and Table 2-5 shows the high-level commands.
Note. Native Inspect cannot currently be used to debug COBOL programs. Visual Inspect is the
recommended debugger for H-series COBOL programs.
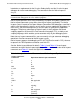
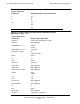
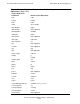
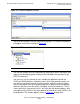
Table 2-4. Inspect Low-Level Commands and Native Inspect Equivalents
Inspect Low-Level
Command Equivalent Native Inspect Command
Aa
Bb
tb
BM mab
C, CM delete
Dd
FC fc
F fopen
FN fn
HIGH Not applicable
Ii
M m[odify]
set
P Not supported
R r[esume]
c[ontinue]