
H-Series Application Migration Guide (H06.03+)

The TNS/E Native Development Environment
H-Series Application Migration Guide—429855-006
2-15
H-Series Common Run-Time Environment (CRE)
Changes
in the H-series RVUs. The ability to switch debuggers can be useful in situations such
as:
•
A native mode program enters the debug state under control of Inspect or Native
Inspect, but you want to use Visual Inspect instead.
•
A TNS mode program automatically enters the debug state under control of Native
Inspect. Since Native Inspect does not support TNS mode debugging, you would
likely want to switch to Inspect.
See the Inspect Manual, the Native Inspect Manual, and the Visual Inspect online help
for details.
INSPECT Attribute Changes
The INSPECT process attribute determines the default debugger for a process. The
debugger selected depends on the platform (TNS/R or TNS/E), execution mode (TNS
or native), and debugger availability. See Process Attributes on page 3-2 for a
comparison of INSPECT attribute behavior on TNS/R and TNS/E platforms.
Debugging at Optimization Levels
The TNS/E native C, C++, COBOL, and pTAL compilers, support three levels of
optimization—0, 1(the default), and 2. Use optimization level 0 or 1 until you have
debugged your program and then use optimization level 1 (if you still want full
debugging capability) or 2.
You can run the TNS/E native debuggers (Native Inspect and Visual Inspect) on code
compiled at optimization level 2. However, the ability to set breakpoints, step through
code, and perform certain other operations is limited. For more details on how
optimization impacts symbolic debugging, see the Native Inspect Manual and Visual
Inspect online help.
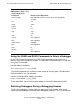
H-Series Common Run-Time Environment
(CRE) Changes
The H-series Common Run-Time Environment (CRE) is unchanged from the G-series,
except for the addition of several new functions.