Native Inspect Manual HP Part Number: 528122-014 Published: February 2012 Edition: J06.12 and subsequent J-series RVUs and H06.
© Copyright 2011, 2012 Hewlett-Packard Development Company, L.P. Legal Notice Confidential computer software. Valid license from HP required for possession, use or copying. Consistent with FAR 12.211 and 12.212, Commercial Computer Software, Computer Software Documentation, and Technical Data for Commercial Items are licensed to the U.S. Government under vendor’s standard commercial license. The information contained herein is subject to change without notice.
Contents About This Document.....................................................................................9 Supported Release Version Updates (RVUs)..................................................................................9 Intended Audience....................................................................................................................9 New and Changed Information..................................................................................................
Access Errors.....................................................................................................................30 Commands For Interactive Memory Debugging......................................................................30 Handling Events.....................................................................................................................30 Assessing Your Location After an Event.................................................................................
Assigning Values to Data Items.................................................................................................51 Assigning Values to Variables..............................................................................................51 Changing the Radix of Numeric Literals................................................................................52 Assigning Values to Level 88 Condition Names......................................................................
Consideration....................................................................................................................73 detach Command...................................................................................................................73 Considerations..................................................................................................................74 Example..............................................................................................................
Examples..........................................................................................................................95 log Command........................................................................................................................97 ls (files) Command..................................................................................................................97 mab Command...................................................................................................
up (up-silently) Command......................................................................................................123 Example.........................................................................................................................123 vector Command..................................................................................................................124 Considerations........................................................................................................
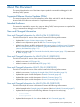
About This Document This manual describes the use of the Native Inspect symbolic command-line debugger for HP NonStop TNS/E systems. Supported Release Version Updates (RVUs) This manual supports J06.03 and all subsequent J-series RVUs and H06.13 and all subsequent H-series RVUs until otherwise indicated in a replacement publication. Intended Audience This manual is intended for anyone who wants to debug TNS/E native processes or snapshot files using a command-line debugger on a TNS/E system.
New and Changed Information for H06.20/J06.09 and H06.17/J06.06 (528122–009) The H06.16 and J06.
• Under the save Command (page 109), indicated that snapshot files of file code 130 are used for offline debugging. • Added the process entered debug event to Table 6 (page 31). • Updated Document Organization (page 11) to include Appendix B. • Changed all references to linespec to locspec. See Syntax of locspec (page 59), which also indicates that locspec is sometimes referred to as linespec in files and documents that are used by or related to Native Inspect.
Last Logon: 14 May 2006, 08:02:23 • A listing of computer code. For example: if (listen(sock, 1) < 0) { perror("Listen Error"); exit(-1); } Bold Text Bold text in an example indicates user input typed at the terminal. For example: ENTER RUN CODE ?123 CODE RECEIVED: 123.00 The user must press the Return key after typing the input. [ ] Brackets Brackets enclose optional syntax items. For example: TERM [\system-name.
error := NEXTFILENAME ( file-name ) ; LISTOPENS SU $process-name.#su-name Quotation marks around a symbol such as a bracket or brace indicate the symbol is a required character that you must type as shown. For example: "[" repetition-constant-list "]" Item Spacing Spaces shown between items are required unless one of the items is a punctuation symbol such as a parenthesis or a comma.
Table 3 Part Numbers and Publication Dates (continued) Part Number Product Version Publication Date 528122–009 Native Inspect H01 February 2009 528122–011 Native Inspect H01 February 2010 528122-012 Native Inspect H01 August 2010 528122-013 Native Inspect H01 September 2011 528122-014 Native Inspect H01 February 2012 HP Encourages Your Comments HP encourages your comments concerning this document. We are committed to providing documentation that meets your needs.
1 Introducing Native Inspect Native Inspect on TNS/E Systems Native Inspect is a system-level command-line symbolic debugger that you use to debug TNS/E native processes and snapshot files. Native Inspect runs only on a NonStop TNS/E host system (not on a TNS/R or TNS system).
1 This is preferred debugger on TNS/E systems. Origins of Native Inspect The first release of the Native Inspect application was based on the Free Software Foundation GDB (Gnu) debugger (version 4.16). In H06.13, the Native Inspect application was derived from WDB (Wildebeest) command-line debugger (version 5.5) and from Tool Command Language (Tcl) version 8.0.4. This release of the Native Inspect application is derived from GDB version 6.8 and Tcl version 8.5.
Comparing Native Inspect to Debug A summary of differences is provided in the following table: Native Inspect Debug The built-in debugger on TNS/E systems. Debugger of last resort on TNS/R and TNS systems; not available on TNS/E systems. A separate product. Part of the HP NonStop operating system. Executes as a separate process from the process being debugged. Executes in the context of the process being debugged.
• Native Inspect does not contain formatting support for SPI buffers. You must use Visual Inspect to display SPI buffers. • The Inspect DISPLAY command is used in Inspect to print variable values. In Native Inspect, the display command is defined to add variables and expressions to the automatic display list – a list that is automatically displayed each time the program is suspended. The Native Inspect print command and output command are equivalents to the Inspect DISPLAY function.
Figure 1 Native Inspect Runs in Same CPU as Current Process Starting Native Inspect You can start or enter Native Inspect in several ways, as follows: • You can start a process under the control of the debugger, subject to the Debugger Selection Criteria (using the TACL RUND command or the run -debug command in OSS). • You can debug a running process (using the TACL DEBUG command).
This command starts Native Inspect on the home terminal of the process $myproc. You can optionally specify a home terminal on which you want Native Inspect to run, as follows: TACL> debug $myproc, term $ztn10.#pthef In OSS, enter a DEBUG command that includes the CPU and process numbers of the process you want to debug as follows: OSS> debug 5,135, term $myterm Native Inspect gains control of the running process subject to the NonStop debugging rules (described in Debugger Selection Criteria (page 20)).
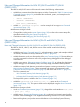
Figure 2 Debugger Selection for a TNS/E Native Process Note that in Figure 3 there is no checking for the INSPECT setting (ON or OFF) for the process. All TNS processes are given to the Inspect subsystem for debugging, so the INSPECT attribute has no effect.
Figure 3 Debugger Selection for a TNS Process Running on TNS/E If you are using Native Inspect and the current process is a TNS process on a TNS/E system, the capabilities available to you are described in Debugging TNS Processes (page 27). Explicitly Starting Native Inspect At the TACL prompt, invoke the Native Inspect object file (EINSPECT) explicitly, using the RUN command, or implicitly, by entering the filename alone.
/G/SYSTEM/SYSTEM gtacl -cpu 2 -p einspect (eInspect 2,-2): After Native Inspect initializes, you must enter the attach command so that you can examine a TNS/E native process. See the attach Command (page 66). The process must be running under your user ID (or you must be either the super ID or the group manager of the user), and must be running in the same CPU as the instance of Native Inspect you started. To examine a snapshot file after starting Native Inspect, use the snapshot command.
Debugging Multiple Processes Native Inspect provides support for debugging multiple TNS/E native processes in both the Guardian and OSS environments. Native Inspect does not provide the same level of multiprocess debugging capabilities that Inspect has traditionally provided and that is available on TNS/E systems by debugging with Visual Inspect. Multiprocess debugging is easiest using either Visual Inspect or separate instances of Native Inspect.
• When debugging multiple programs, Native Inspect, like Inspect, sets the designated current process to be the process for which the most recent debugging event has been reported. The current process is the process to which all commands apply and for which Native Inspect waits for events. • Use the vector command to explicitly change the designated current process. • In a rare situation, two instances of Native Inspect can be running on different CPUs but be prompting the same home terminal.
Example of Using Multiple Instances of Native Inspect You are running Native Inspect in CPU 3 and are debugging the process $DISK1.MYSUBVOL.MYPROG (CPU,pin=3,301). A second debugging target named $DISK2.SVOL2.YOURPROG (CPU,pin=3,32) is assigned to your instance of Native Inspect.
Inspect (that is, the registered global debugger) to debug all processes in a CPU that encounter the global breakpoints. Considerations for Global Debugging • Privileged mode must be enabled before you can set breakpoints in or examine privileged code. You must logon with the super ID and explicitly enable privileged mode debugging by entering the priv command. • To set a global breakpoint, you must enable privileged debugging and then specify the -g flag when setting a breakpoint.
Creating a Snapshot File You can create snapshot files in several ways, as follows: • Using the save command (Native Inspect) • Using the Save Snapshot command (Visual Inspect) • Using the SAVE command (Inspect) Snapshot files are also created by the snapshot server (INSPSNAP) if the SAVEABEND attribute for a process is ON and the process abends.
when the DLL is loaded, Native Inspect again attempts to load the symbols using the actual load address for the DLL. Setting Breakpoints Native Inspect does not support the ability to set breakpoints on DLL functions before the DLL is loaded; you must wait until the DLL is loaded. Use the add-symbol-file command if you want to specify the base address relative to which symbolic addresses are calculated.
increase and this can result in serious consequences for long-running applications and memory intensive applications. Memory leaks can also cause fragmentation of the heap. This slows down the allocation, de-allocation, and access of memory blocks and can eventually cause the application to fail with out-of-memory errors. You should suspect a memory leak in an application if the system runs out of swap space, runs slower, or both.
Table 6 Event Handling by Native Inspect Events Response by Native Inspect Breakpoint events Displays current code location (PC) and prompts user for input. (For TNS code breakpoint, displays the current native code location.
When you switch to another debugger and return to Native Inspect the breakpoint status is as follows • Breakpoint attributes are preserved for existing breakpoints. • Breakpoints that you deleted using the other debugger are deleted from Native Inspect's breakpoint list. • Breakpoints that you added using the other debugger are added to Native Inspect's breakpoint list, with default attribute values.
2 Using Native Inspect Quick Start for Inspect Users Table 8 lists the principal Native Inspect commands and their Inspect equivalents. This table is a useful cross-reference for users familiar with Inspect commands. • For a more complete list of Inspect commands and equivalent Native Inspect commands, see Table 16 (page 136). • For a list of Debug commands and their equivalent Native Inspect commands, see Table 15 (page 135).
1. 2. 3. 4. Compile your program files, and transfer them to the TNS/E host if necessary. Gain debugging control of a process by using Native Inspect. Load symbols information for the current process, if necessary. Optionally, configure a search path for source files. These steps are described in more detail in the following sections. Compiling and Transferring Program Files You have the following options for compilation: • The TNS/E host by using a resident compiler.
You must enter separate symbol commands for all files of interest, using one symbol command to load the symbols for your program file, and separate symbol commands for each DLL. Native Inspect automatically reads in symbol table information for DLL loadfiles that are loaded in response to the dlopen() system call. Similarly, the symbol table is automatically discarded if the DLL is unloaded using the dlclose() system call.
Optionally Determining the Compilation-Time Source File Name If you are debugging on a different system from the one used for compiling, Native Inspect cannot locate your source files at their originally compiled locations. For this reason, the list command will not be able to list your program source and will report an error: (eInspect 0,384): list Unable to open file \SIERRA.$YOSE.MHG2.
You can change this default behavior by entering a set command (environment) with the continue-to-main option set to off. You should include this command in the EINSCSTM file (located in your default logon directory) so that it is executed during Native Inspect initialization.
Added process (3,591). Switching process (3,591) to eInspect from DMON Process (3,591) created using DEBUG option. (eInspect 3,591): Listing the Source The following example shows an attempt to display the source code using the list command: (eInspect 3,591):list \PIPPIN.$D0117.NITEST.GARTCC: No such file or directory. (eInspect 3,591):dir $data3.nitest Source directories searched: $data3.
Printing Variables and Memory The following example shows how to print variables and display memory contents by using the print and x commands: (eInspect 3,591):print local_ptr1 $1 = 0x80001f0 "From main" (eInspect 3,591):print /x &local_ptr1[0] $2 = 0x80001f0 (eInspect 7,911):print local_ptr2 $10 = 0x6ffffedc "Hello world" (eInspect 7,911):x /4 local_ptr2 0x6ffffedc: 72 'H' 101 'e' 108 'l' 108 'l' The output from the preceding example shows the following: • Use of the print command to print the values
Process (3,591) received DS_EVENT_MAB (seg:65535, addr:0x6FFFFE44, pc:0x70002862 , len:4 type:1) A1::func(char *, int) (this=0x6ffffe40, string=0x8000220 "From call1", c=1) at \PIPPIN.$D0117.NITEST.GARTCC:29 29 } (eInspect 3,591):print *this $5 = { a = 0x8000220 "From call1", b = 1 } The output from the preceding example shows the following: • Use of the mab command to set a memory access breakpoint on a scalar variable.
DATA3 COBBAT 53> rund xcs000ds0 TNS/E eInspect gdb Debugger [T1237 - 20-Dec-2011 16:43] Copyright 2008 Free Software Foundation, Inc. Copyright 2003-2012 Hewlett-Packard Development Company, L.P. Native Inspect (based on GDB) is covered by the GNU General Public License. Type "show copying" for conditions for changing and/or distributing copies. Type "show warranty" for warranty/support information. TWorking directory \PELICAN.$SYSTEM.SYSTEM. Symbols read in for program loadfile \PELICAN.$DATA3.COBBAT.
88 SEQ1-FILE-OPENED VALUE 1. (eInspect $1 = F (eInspect $2 = 1 (eInspect $3 = T (eInspect 3,1012):print seq1-file-er 3,1012):print seq1-flag 3,1012):print seq1-file-opened 3,1012):continue Examining a Record The following example shows how to examine a record by using the next, print, and p commands: Breakpoint 2, CALE-1 () at \PELICAN.$DATA3.COBBAT.SCS000D:319 319 PERFORM READ-SEQ1-TABLE THRU SEQ1-TABLE-EXIT 4 TIMES.
(eInspect 3,1012): p rtq6 of rtq3 in rtq1(4,2,3,4,2) $67="GH" The preceding example demonstrates the following: • Record field names that are unique do not require qualification. Native Inspect reports an error if the name is not unique. • You can qualify field names using COBOL OF or IN syntax, or the Native Inspect period (.) syntax.
NAME = "Bellini " WORKS = ( TITLE = "Semiramide " LISTING-INFO = CONDUCTOR = "Davis " PRICE = "$34,597.00" TITLE = "Norma " LISTING-INFO = CONDUCTOR = "Rudel " PRICE = "$34,602.00" (eInspect 3,1012): print title(1,2) Reference to TITLE is not unique. Add more qualification to disambiguate the reference. (eInspect 3,1012): print title of works of who of recording-data (1,2) $5 = "Boheme " (eInspect 3,1012): print recording-data.who.works.
R5132 = "212") (eInspect 1,301): p r5132(1,2) $45 = "112" (eInspect 2,924): p r5132(2,3) $8 = "212" (eInspect 1,305): ptype rec-a type = RECORD ITEM-A PIC 99 DATA-A PIC X OCCURS ITEM-A (MAX:10) TIMES (eInspect 1,305): # (eInspect 1,305): # Let's set DEPENDING ON parameter, i.e. "ITEM-A", to 5 (eInspect 1,305): # (eInspect 1,305): set rec-a.item-a = 5 (eInspect 1,305): p rec-a $4 = ITEM-A = 05 DATA-A = ("A", "A", "A", "A", "A") (eInspect 1,305): set rec-a.
106 107 108 109 ?SECTION RANGE-110-112 110 DISPLAY " CLIBCLB1: RANGE-110-112: line 110". 111 DISPLAY " CLIBCLB1: RANGE-110-112: line 111". 112 DISPLAY " CLIBCLB1: RANGE-110-112: line 112". 113 114 (eInspect 3,1012):b CLIBCLB1:110 Breakpoint 2 at 0x700063b0:0: file \YOSQA1.$DATA1.SHCOBAT.CLIBCLB1, line 110. Breakpoint 3 at 0x70006f30:0: file \YOSQA1.$DATA1.SHCOBAT.CLIBCLB1, line 110. Breakpoint 4 at 0x70007770:0: file \YOSQA1.$DATA1.SHCOBAT.CLIBCLB1, line 110. (eInspect 3,1012):c Continuing.
3 Using Native Inspect With COBOL Programs This section describes concepts and additional details for using Native Inspect with COBOL programs. Understanding how Native Inspect finds Data Items Native Inspect follows COBOL scoping rules for finding data items specified in Native Inspect commands. That is, Native Inspect attempts to find the item in the current program unit (the program unit where execution is currently suspended).
Specifying Variables and Tables Specifying Variables To reference a variable that is a unique member of only one record in a COBOL program, you simply specify the variable name. For example, consider the following declaration in a COBOL program: 01 REC. 02 VAR NATIVE-2. 02 STR PIC X(9). As long as the variables are unique within the program unit, you can specify the variable VAR and STR in any Native Inspect command that accepts a variable name.
When referencing a multilevel table in Native Inspect, you can apply subscripts only to the last item in the reference. For example, consider the following declaration: 01 VEHICLE. 03 MODEL OCCURS 9 TIMES. 05 STYLE OCCURS 12 TIMES. 07 COLOR OCCURS 15 TIMES PICTURE 9(10). Examples of valid table references are as follows: MODEL (3) STYLE OF MODEL (3,11) COLOR OF STYLE OF MODEL (3,11,14) MODEL.STYLE.COLOR (3,11,14) You reference an entire table by specifying the table name without subscripts.
01 REC. 02 TABLE OCCURS 4 TIMES. 03 ITEM PIC 99. 88 ITEM-OK VALUE 12. Any reference to ITEM-OK requires a subscript because any reference to ITEM requires a subscript. For example, the following command evaluates and displays the second instance of ITEM-OK: (eInspect 3,1012):print ITEM-OK(2) Displaying Variables Native Inspect follows COBOL rules for displaying numeric, alphanumeric, and edited data items.
03 TABLE-2 OCCURS 5 TIMES. 04 ELEMENT PIC X. (eInspect 1,821):print length MASTER $2 = 25 (eInspect 1,821):print length (MASTER.TABLE-1(1)) $3 = 5 (eInspect 1,821):print length TABLE-2(1,1) $4 = 1 For tables with a variable upper bound, the maximum length of the table is displayed irrespective of the value of the data item specified in the DEPENDING ON clause. For example, consider the following declaration: 01 MASTER. 03 ITEM PIC 99 VALUE 7. 03 TABLE4 OCCURS 5 TO 10 TIMES DEPENDING ON ITEM.
• If the name of a variable is the same as a Native Inspect option recognized by the set command, you must use either the print command with the assignment operator or the variable clause of the set command to assign a value to the variable. • The maximum size of a numeric literal is 18 decimal digits, 16 hexadecimal digits, or 22 octal digits. Changing the Radix of Numeric Literals The default radix of a numeric literal is base 10.
(eInspect 1,1032): print rec6={{1,2,3,4,5,6,7,8,9,10}12} $1 = ARRAY = (1, 2, 3, 4, 5, 6, 7, 8, 9, 10) ANOTHER2 = 12 If, in an assignment, you specify more values than there are elements in the table, an error is generated. If you specify fewer values, the assignment terminates when all values in the list are used. You cannot assign a value to an entire table or record by specifying a single value.
GREATER NOT GREATER LESS THAN NOT LESS THAN EQUAL TO NOT EQUAL TO • Conditional expressions use the following logical operators: AND OR • The following symbols are supported: > < <> <= >= If a variable is specified as the result of an expression, Native Inspect stores as much of the result as possible as allowed by the variable’s type. Native Inspect does not allow the use of the following in expressions: • Intrinsic functions. • Class conditions. • Sign conditions. • Switch-status conditions.
program using program unit and paragraph names, in addition to source line numbers. When program execution is suspended, you can resume execution by entering the continue command. A program executes until one of the following conditions is true: • It encounters a breakpoint. • It calls the DEBUG or PROCESS_DEBUG_ procedure. • It generates a trap. • It terminates.
4 Native Inspect Command Syntax Categories of Native Inspect Commands In Table 11, Native Inspect commands are grouped as follows: • Command Line Options, such as: help and nocstm. • Utility Commands, such as: files and dir. • Session Control Commands, such as: attach (detach) and switch. • Snapshot Commands, such as: save and snapshot. • Process Control Commands, such as: continue and next. • Execution Control Commands, such as: ih and mh.
Table 11 Native Inspect Command Functions (continued) Group Name and Command Name Function map-source-name (map) Command Defines mapping rules between the source file names at compilation time and at debug time. pwd Command Prints the current working directory. quit (exit) Command, exit (quit) Command Ends the Native Inspect session. set Command (environment) Sets environment settings for Native Inspect. show Command Displays environment settings for Native Inspect.
Table 11 Native Inspect Command Functions (continued) Group Name and Command Name Function catch Command Sets a logical breakpoint on a specified event. commands Command Specifies commands that Native Inspect is to execute when a specified breakpoint is hit. condition Command Specifies a conditional expression that Native Inspect is to evaluate when a specific breakpoint is hit. delete Command Deletes code breakpoints. disable Command Disables specified breakpoints.
Table 11 Native Inspect Command Functions (continued) Group Name and Command Name Function tj Command, tu Command Traces the stack from a TNS/E native jump buffer (tj command) or a ucontext buffer (tu command) contained at the specified address. up (up-silently) Command Selects the stack frame that called the currently selected stack frame. Object and Symbol File Commands add-symbol-file Command Add additional symbol file information. list Command Lists source code.
locspec Use locspec to do the following: • Specify a single source line with the list command to display source lines. • Specify where to set a code breakpoint with the breakpoint command. You can specify locspec using any of the following forms: line-number Specifies a line number in the current file. filename:line-number Specifies a line number in the specified source file filename. function Specifies the line at which the body of the specified function begins.
NOTE: • In a paragraph number, the leading zero is significant. • If locspec consists entirely of digits, and that string of digits matches both a paragraph name and a line number in the program unit, Native Inspect uses the paragraph name. To specify the line number in this case, use the filename:line-number notation. • COBOL paragraph names need not be unique within a program unit. To differentiate among paragraphs with the same name, specify a qualified paragraph name using the section.
mask A 64-bit mask that will be ANDed with the contents of native-address before the test is performed with value. operator The operator is one of the following strings: • != • == • < • > value An integer. Syntax of expression expression A list of operands and operators which, when evaluated, result in a number or a string. Valid operators are those accepted by the source language in which the target being debugged is compiled. Native Inspect does not support expressions in pTAL.
$register-name displays the contents of the specified register. For example, print $pc displays the contents of the $pc register. Syntax of /format /format A repeat count, followed by a format letter and a size letter in any order as follows: /[count][format][size] count An integer specifying the number of units of size to display or print.
• Any size letter. • A repeat count of more than 1. Specifying Pathnames in Native Inspect Commands Certain Native Inspect commands require you to specify either an OSS pathname or Guardian file name. Here are the rules Native Inspect follows for resolving pathnames and determining the current working directory. Resolving Pathnames If you specify an OSS or Guardian absolute pathname, that pathname is used regardless of whether the current working directory is an OSS or a Guardian working directory.
native-address This is the address in memory that you want to display in ASCII. See Syntax of native-address (page 61). count This is the amount of memory to display. The default value is one byte. add-symbol-file Command Reads debugging symbols from the specified loadfile (file code 800). This command enables you to optionally specify the base address relative to which symbol addresses are computed. The new symbol data is added to the existing data.
attach Command Associates Native Inspect with a specified process that must be executing in the same CPU as the Native Inspect process. The attach command enables you to debug a running process using Native Inspect. attach [pin] | [$process-name] Where: pin The process ID (process number) of the process you want to attach. The command fails if you specify an invalid or nonexistent pin. To attach to a running OSS process, you must use its Guardian process ID.
break (tbreak) Command The break command sets an instruction breakpoint for the current process, at a specified line, function, or address. The tbreak command is similar, but sets a temporary breakpoint that is deleted after it is hit. Related Commands: Use the enable command (see enable Command (page 78)) and disable command (see disable Command (page 75)) to enable and disable breakpoints, respectively.
Examples • To set code breakpoints: (eInspect 1,325): b 216 Breakpoint 1 at 0x70001670:2: file \SIERRA.$YOSE1.SYMBAT1.SCXXTST, line 216. (eInspect 1,325): b test_complexTypes Breakpoint 2 at 0x70003700:0: file \SIERRA.$YOSE1.SYMBAT1.SCXXTST, line 420. • To set a code breakpoint in a COBOL nested program unit: (eInspect 4,668): b main.main-level2 Breakpoint 1 at 0x70002280:2: file \SIERRA.$DIVA.CBDEMO, line 41.
Num Type Disp Enb Glb Address What 2 mem access brk keep y n globStr.f2 -c bt (tn) Command Prints a backtrace of all stack frames. Frame numbers are preceded by a number sign, (#). Alias: tn. {bt|tn} [count] Where: count An integer that displays a backtrace of the innermost count frames. If you specify a negative count, then a backtrace of the outermost -count frames is displayed.
• disable (see disable Command (page 75)). • info with the breakpoints option (see info Command (page 86)). To display a list of current catch events, use the info command (see info Command (page 86)) with the breakpoints option. Managing a Stopping Process (STOP and ABEND Events) When a process triggers a STOP or ABEND event, the process is in a stopping state. You can examine a process that is in a stopping state, but the process cannot execute any further.
comment (#) Command A Tcl command that introduces a line of comment. Alias: # command. (See # (comment) Command (page 64)). {comment|#} [text] Either comment or # must be the first non-blank character in the line. The entire line is then treated as a comment. condition Command Specifies a conditional expression to be evaluated when a breakpoint is hit. The breakpoint is reported only if the condition evaluates to TRUE.
Where: commandname The name of the command to be defined. If a command by that name already exists, you are asked to confirm if you want to redefine that command. Usage Note A user-defined command is a sequence of commands to which you assign a new name as a command. This is done with the define command. User commands can accept up to 10 arguments separated by whitespace. You access arguments within the user-defined command by specifying $arg0 ... $arg9.
Example To display memory using the Debug-compatible a and d commands: (eInspect 3,663): d 0x8005884 0x8005884: 0x6d6f6e69 0x8005894: 0x00000000 0x80058a4: 0x00000000 (eInspect 3,663): a 0x8005884: .moni. 0x8005894: ...... 0x80058a4: ...... 10 0x746f7200 0x00000000 0x00000000 0x8005884 10 .tor.. ...... ...... ...... ...... 0x00000000 0x00000000 0x00000000 0x00000000 ...... ...... delete Command Deletes code breakpoints.
Related Commands: Detach is the complement of the attach command. (See attach Command (page 66).) detach [pin] | [$process-name] Where: pin The process number of a process under the control of Native Inspect from which you want to detach. $process-name The name of the process or process-pair under the control of Native Inspect from which you want to detach. Considerations • Before entering the detach command, you should typically clear all breakpoints in the process and continue process execution.
Source directories searched: $d0117.kris:$d0117.test:$cdir:$cwd (eInspect 5,855): show directories Source directories searched: $d0117.kris:$d0117.test:$cdir:$cwd disable Command Disables specified breakpoints, which remain defined but are not hit until reenabled. Use the enable command (see enable Command (page 78)) to enable a disabled breakpoint. If you do not enter any breakpoint numbers, the command disables all the breakpoints associated with the current process. Abbreviations dis and disa.
{da|disassemble} [[start-address][end-address] | function-name] Where: start-address Specifies the starting address of the range of instructions to display. end-address Specifies the ending address of the range of instructions to display. function-name Specifies a function to display. NOTE: You can use the x command to display a specified number of instructions starting at a specified address.
Example • To use the automatic display list: (eInspect 4,798): display pcb->attributeCount 1: pcb->attributeCount = 1 (eInspect 4,798): display pcb->pin 2: pcb->pin = 0 (eInspect 4,798): next 364 PCB_addAttribute( pcb, PCBAttribute_createNonstop( PCBLis t.entry[10] ) ); 2: pcb->pin = 0 1: pcb->attributeCount = 2 (eInspect 4,798): next 365 memcpy( gBuffer, pcb, sizeof( PCB_t ) ); 2: pcb->pin = 0 1: pcb->attributeCount = 3 (eInspect 4,798): disable display 1 2 (eInspect 4,798): next 369 pcb = PCBList.
Where: commandname The name of the command to be defined. If a command by that name already exists, you are asked to confirm if you want to redefine that command. Usage Note A user-defined command is a sequence of commands to which you assign a new name as a command. This is done with the define Command (page 71). User commands can accept up to 10 arguments separated by whitespace. You access arguments within the user-defined command by specifying $arg0 ... $arg9.
1 breakpoint keep y 0x70002540 in pcbDataStructs_initialize at \SIERRA.$YOSE1.SYMBAT1.SCXXTST:352 stop only if pcb->pin == 2 print PCB enable display Command Enables the evaluation and display of a previously disabled display expression. If you do not specify a number, the command displays all the previously displayed expressions on the automatic display list. enable display [number] Where: number An ordinal number that identifies an expression on the automatic display list.
fc [command-number|command-string] Where: command-number The number of the command you want to redisplay, edit, and reexecute. Use the show command (see show Command (page 116)) with the commands option to display the commands entered in the current session. command-string The first few letters of the command you want to redisplay, edit, and reexecute.
fn value [start-addr [end-addr]] [type] Where: value The value you want to find. The fn command does not infer the bit size of value based on its magnitude. start-addr The address where the search is to begin. end-addr The address where the search is to end. type The bit size of value (8, 16, 32, or 64 bits). The default value is 32 bits. The search increment is the same as the bit size.
Open Nowait Depth 0 Open Sync Depth 0 Open Options 0 Physical Record Length 4096 Bytes Outstanding Requests 0 Error 0 Error Detail 0 Disk File Information. End of File 0 Bytes Current Record Pointer 0 Next Record Pointer 0 Modification Timestamp 2008-03-03 15:52:52 Extent Size 28 Pages, 28 Pages File Code 0 Flags DEMOUNTABLE WRITE-THRU Block length 0 Bytes Logical Record Length 0 Bytes Maximum Extents 0 Partitions 0 (eInspect 2,1071):fopen 3 -d Name /home/vi/a Filenum 3 OSS File Information.
Considerations The currently selected frame (specified in the frame command) is distinguished from the current program location (the frame at which execution is suspended), subject to the following conditions: • Most Native Inspect commands operate on the currently selected frame. • Execution-control commands, such as step and next, operate on the current program location. • For COBOL programs, the CALL stack records the history of active program unit invocations.
data -- Examining data filecmd -- Specifying and examining files internals -- Maintenance commands obscure -- Obscure features running -- Running the program stack -- Examining the stack status -- Status inquiries support -- Support facilities tracepoints -- Tracing of program execution without stopping the program user-defined -- User-defined commands Type "help" followed by a class name for a list of commands in that class. Type "help" followed by command name for full documentation.
(eInspect 3,1179): ih Signal SIGHUP SIGINT SIGQUIT SIGILL SIGURG SIGABRT SIGIO SIGFPE SIGKILL SIGSEGV SIGWINCH SIGPIPE SIGALRM SIGTERM SIGUSR1 SIGUSR2 SIGCHLD SIGRECV SIGSTOP SIGTSTP SIGMEMERR SIGNOMEM SIGMEMMGR SIGSTK SIGTIMEOUT SIGLIMIT SIGCONT SIGTTIN SIGTTOU SIGABND Priv/Non N N N N N N N N N N N N N N N N N N N N N N N N N N N N N N Handler Mask 0xfffc0000 0xfffc0000 0xfffc0000 0xfffc0000 0xfffc0001 0xfffc0000 0xfffc0001 0xfffc0000 0xfffc0000 0xfffc0000 0xfffc0001 0xfffc0000 0xfffc0000 0xfffc0000 0xf
0x70001c80:0 : [MMI] alloc r34=ar.pfs,19,16,0 0x70001c80:1 : adds r12=-128,r12 0x70001c80:2 : mov r36=r1;; 0x70001c90:0 : [MII] nop.m 0x0 0x70001c90:1 : mov r35=b0 0x70001c90:2 : mov r37=r32 0x70001ca0:0 : [MMB] mov r38=r33 0x70001ca0:1 : adds r39=80,r12 0x70001ca0:2 : nop.b 0x0;; 0x70001cb0:0 : [MII] st8 [r39]=r37 0x70001cb0:1 : adds r40=88,r12 0x70001cb0:2 : nop.
frame frame-number Prints information about the current or the specified stack frame. To display frame numbers, use the bt command. The frame at which execution is currently halted is numbered 0, and frame numbers continue consecutively to the base frame, from which execution began. functions regular-expression Prints all function names or those matching the specified regular expression. handle signal-number Displays the response that Native Inspect gives when the current program receives various signals.
types regular-expression Prints all type names, or those matching the specified expression. variables regular-expression Prints all global and static variable names, or those matching the specified expression. warranty Prints the various types of warranty that Native Inspect users do not have. Examples • To display frame information: (eInspect 2,676): info frame Stack level 0, frame at 0x6ffffe50: ip = 0x70002300:0 in pcbDataStructs_initialize (\SIERRA.$YOSE1.SYMBAT1.
(eInspect 3,663): info line Line 341 of "\SIERRA.$YOSE1.SYMBAT1.SCXXTST" starts at address 0x70002320:0 and ends at 0x700023c0:0 . • To display registers for a frame: (eInspect 3,663): info frame 1 Stack frame at 0x6ffffe80: ip = 0x70003870:0 in test_complexTypes (\SIERRA.$YOSE1.SYMBAT1.SCXXTST:425); saved ip 0x700016b0:0 called by frame at 0x6ffffef0, caller of frame at 0x6ffffe50 source language c.
br1: br2: br3: br4: br5: br6: br7: ip: cfm: ra: sp: psp: bsp: lc: ec: 0x0 0x0 0x0 0x0 0x0 0xffffffffe18a3840 0xffffffffe1555440 0xffffffffe2207040 0x0 0x0 0x6fffff50 0x6fffff50 0x6e000000 0x0 0x0 info Command (memory leak detection) Displays commands to debug memory problems. info attribute value Where: attribute value Where attribute value is one of the following: corruption Checks for corruption in the currently allocated heap blocks.
Examples • To obtain a heap profile, perform the following steps: 1. Run the debugger, load the program, and issue the set heap-check on command: For 32-bit application: TACL> rund minheap /lib $system.sys00.
5. To view a specific allocation, specify the allocation number as an argument to the info heap command. For example: (eInspect 0,248)info heap 1 4096 bytes at 0x7bd63000 (9.86%of all bytes allocated) in bar ()at test.c:108 in main ()at test.c:17 in _start () in $START$() When multiple blocks are allocated from the same call stack, Native Inspect displays additional information similar to the following: (eInspect 0,248)info heap 3 245 bytes in 8 blocks (0.
No. 0 • Total bytes 49000 Blocks 1000 Address 0x4044eff0 Function main() To view the leak profile, perform the following steps: 1. Run the debugger, load the program, and issue the set heap-check leaks on command: For 32-bit application: TACL> rund minheap /lib $system.sys00.
To suspend execution at the destination location, first enter the break command to plant a temporary breakpoint. Example To jump to a specified location (line 51): (eInspect 3,638): list 44 } 45 46 void call1(char *string,long long q) 47 { 48 eight_byte_struct structure; 49 structure.a = "from call1"; 50 structure.b = 1; 51 printf("%s q = %d\n",string,q); 52 print_and_break(); 53 call2(structure); (eInspect 3,638): fr 0 #0 call1 (string=0x0, q=0) at C:\cygwin\home\save\test\gartest.c:49 49 structure.
size to a value other than 10. The show Command with the listsize option shows the current value of the list size. For information specific to COBOL programs, see Displaying Source Lines (page 47). list [start-locspec][,end-locspec] [+|-] Where: start-locspec The location at which the source code display is to begin. If you omit start-locspec, Native Inspect lists source lines relative to the current program location or the last listed source location. See Syntax of locspec (page 59).
381 pcb->state = PCBState_ready; 382 pcb->flags.item.isReady = 1; 383 pcb->flags.item.isHappy = 1; 384 385 PCBList_add( &PCBReadyList, PCBList.entry[2] ); 386 pcb = PCBList.entry[2]->ref.pcb; (eInspect 1,463): list 387 pcb->state = PCBState_ready; 388 pcb->flags.item.isReady = 1; 389 pcb->flags.item.isHappy = 1; 390 391 PCBList_add( &PCBReadyList, PCBList.entry[4] ); 392 pcb = PCBList.entry[4]->ref.pcb; 393 pcb->state = PCBState_ready; 394 pcb->flags.item.isReady = 1; 395 pcb->flags.item.
log Command Turns logging on or off: • If you specify a pathname, logging is turned on. • If you omit the pathname, Native Inspect turns off logging and closes the current log file. log [pathname|-d] Where: pathname The OSS pathname or Guardian file name of the log file. Native Inspect creates a text file (file code 101) in the current working directory or in the location you specify in the log command. If the log file already exists, Native Inspect opens it and appends output to it.
size An optional number of bytes if you specify a variable. By default, Native Inspect uses the size of the variable as the address range to watch. If you specify *native-address, you must also specify size. The range over which a MAB is set (that is, the combined value of native-address and size) cannot exceed a 16K-page boundary. flags Specifies one of the following flags: -c Specifies change access, which triggers a breakpoint when the value changes.
• To set a MAB on 4 bytes at a given address: (eInspect 1,480): mab *0x00000070 4 • To set a MAB on variable j when it changes: (eInspect 1,480): mab j -c • To set a “change” MAB: (eInspect 1,480): mab PCBList.count -c map-source-name (map) Command Defines filename mapping rules between source file names at compilation time and at debug time. Related Commands: Use the dir Command to append a directory (subvolume) to the search path used to locate source files.
Considerations • A time-saving use of the map = alias-name form of the map command (source name omitted) is to specify this command after receiving an error from a list command. The current source file name is assumed, thus eliminating the need to copy-and-paste or retype the name displayed in the list command error message. • New aliases created as a result of prefix matches are added to the mapping list.
Table 12 TNS/E Signal Names SIGHUP1 SIGSTOP1 SIGINT SIGTSTP1 SIGQUIT1 SIGMEMERR SIGILL SIGNOMEM 1 SIGURG SIGMEMMGR SIGABRT SIGSTK SIGIO1 SIGTIMEOUT SIGFPE SIGLIMIT SIGKILL1 SIGCONT1 SIGSEGV SIGTTIN1 SIGWINCH1 SIGTTOU1 SIGPIPE1 SIGABND1 SIGALRM1 SIGTERM1 SIGUSR11 SIGUSR21 ZSIGCHLD1 SIGRECV1 1 Indicates signals that apply only in the OSS environment. Other signals apply in both the OSS and native Guardian environments.
SIGSTK SIGTIMEOUT SIGLIMIT SIGCONT SIGTTIN SIGTTOU SIGABND N N N N N N N 0xfffc0000 0xfffc0000 0xfffc0000 0xfffc0001 0xfffc0000 0xfffc0000 0xfffc0000 0x0 0x0 0x0 0x0 0x0 0x0 0x0 0x0 0x0 0x0 0x0 0x0 0x0 0x0 modify (mn) Command A Debug-compatible Tcl command that changes the content of memory at native-address to value. modify native-address value {8|16|32|64} Where: native-address The address in memory whose contents you want to change. See Syntax of native-address (page 61).
227 PCB_t *pcb = (PCB_t *) malloc( sizeof( PCB_t ) ); (eInspect 1,329): next 228 memset( pcb, 0, sizeof( PCB_t ) ); (eInspect 1,329): finish Run till exit from #0 PCB_create () at \SIERRA.$YOSE1.SYMBAT1.SCXXTST:228 0x70002520:0 in pcbDataStructs_initialize () at \SIERRA.$YOSE1.SYMBAT1.SCXXTST:351 351 pcb = PCB_create(); Value returned is $2 = (PCB_t *) 0x0 nocstm Option The nocstm command-line option specifies that Native Inspect is not to execute the commands in the custom startup file named EINSCSTM.
print [format] expression Where: format An optional count, format, and size specification. See Syntax of /format (page 63). expression Evaluates the expression and assigns its value to a variable. In COBOL expressions, use COBOL operators, and in C and pTAL expressions, use the standard C assignment operators, including +=, *=, and \=. See Syntax of expression (page 62).
Examples • To display constant expressions, (compared to display of eq command), use the following command: (eInspect 3,638): $9 = 0x6fffff89 (eInspect 3,638): $8 = 64 '@‚ (eInspect 3,638): OCT: 000100 DEC: • print /x 0x6ffffe40 + (47 *7) print /c 64 eq 64 64 HEX: 0x0040 ASCII: '...
(eInspect 3,663): $24 = 20 • To display an instruction pointer: (eInspect 3,663): $29 = 0x70002bf0 • print $gr33 += 10 print /x $ip Use the @ symbol to control the number of instances printed. In this example, three commands contain the @ symbol. The first command displays two instances of the entire attribute array. The second command displays three array elements starting at element 1.
item = { isBad = 0, isReady = 1, isHappy = 0, isStarved = 0, waitState = 0 } }(eInspect 1,463): print /t (unsigned long) pcb->flags $5 = 1000000000000000000000000000000 • To display an item from the value history list: (eInspect 1,463): print *PCBList.
priv Command Sets, unsets, or shows the privilege level of the debugging session. The privilege level in turn controls whether a user can perform privileged debugging operations such as setting breakpoints on or stepping in to privileged functions. To use the priv command to turn privileged debugging on or off, you must be logged on as the super ID. Entered with no options, displays the current priv mode status.
{quit|exit} When you enter a quit or exit command, Native Inspect detaches itself from the current process and stops. If you exit while a process is suspended, it is automatically resumed. If breakpoints are set in a process, Native Inspect prompts you whether you want to continue. If you do, another debugger instance is started if one of the breakpoints is hit. reg Command A Tcl command that displays registers for the currently selected stack frame.
NOTE: If no value is specified, the debugger may or may not compress the snapshot file based on its size. ! Forces the overwriting of the specified snapshot file. If you do not include the exclamation mark(!), and the specified file already exists, Native Inspect reports an error. The save command returns control to the target process. Consequently, when you list the save in a sequence of commands by using the commands command, the save command must always be the final command in the sequence.
Sets history expansion on command input. • filename {on|off} Sets the name of the file in which the command history is recorded. • save {on|off} Sets saving of the history record on exit from Native Inspect. • size number Sets the size of the command history. The default value is 256. input-radix {8|10|16} Sets the default input radix for entering numbers. language {ptal|c|c++|cobol} Sets the current source language. When debugging pTAL using Native Inspect: • You must use C/C++ syntax.
print sub-attribute value Where sub-attribute is one of the following: address {on|off} sets printing of addresses. array {on|off} Sets pretty printing of arrays (prints one field per line rather than compressing multiple fields on one line). See the Examples (page 105) following the print command syntax. dereference [{on|off}] Controls the display of char * variables. The default is on , and char * variables are automatically dereferenced for display.
radix {8|10|16} Sets the input and output number radices. symbol-reloading {on|off} Sets dynamic symbol table reloading multiple times in one run. verbose {on|off} Sets verbosity (information about progress is displayed as a command executes). width number Sets the number of characters Native Inspect expects in a line. Examples • To set pretty printing on and off: (eInspect 4,770): set print pretty off (eInspect 4,770): print pcb $2 = (PCB_t *) 0x0 (eInspect 4,770): c Continuing.
• To set the number of elements to print: (eInspect 4,774): (eInspect 4,774): $5 = {0x0, 0x0, 0x0, 0x0, 0x0...} • set print elements 5 print pcb->attribute To set print dereference, use the following commands: (eInspect 4,774): list 1 1 char * hw = "hello world!"; 2 main() 3 { 4 printf("%s\n", hw); * 5 } (eInspect): show print dereference Suppress dereferencing of char * is on.
value A value you want to assign to var-name. Consideration Although the keyword variable is optional, you must include it if the name of the variable you are setting conflicts with the name of an option supported by the set Command (environment). For example, a variable name p conflicts with the print option of the set command, and entering a set command without the variable keyword results in an error: (eInspect 1,187): set p=6 Undefined set print command: "=6". Try "help set print".
min-leak-size num Collects a stack trace only when the size of the leak exceeds the number of bytes you specify for this value. Larger values improve run-time performance. The default value is zero (0) bytes. string [on | off] Toggles validation of calls to strcpy, strncpy, memcpy, memccpy, memset, memmove, bzero, and bcopy. Native Inspect validates calls to strcat and strncat. Examples • To enable heap checking, enter the following: For 32-bit application: TACL> rund minheap /lib $system.sys00.
heap-check Displays all current settings for memory checking. listsize Displays the current value of the size of the list displayed by the list command. user commandname Displays definitions (but not documentation) of user-defined commands. If commandname is not specified, this displays the definitions for all user-defined commands. When user-defined commands are executed, the commands of the definition are not printed. An error in any command stops execution of the user-defined command.
(eInspect) source inspcmd Can not locate command file ninspcmd(eInspect) source ninspcmd Suppose you have the following commands in a file: list show language info target show dir If you run a program and source this file in, you will see the following: (eInspect 1,749): source $data3.subvol.
switch Command Transfers the current process to either Visual Inspect or Inspect, as appropriate: • Transfers a TNS/E native process to Visual Inspect. You must be running a Visual Inspect client (on Windows) connected to the NonStop system using the same user ID as the TNS/E native process. • Transfers a TNS process to Inspect. switch After you enter a switch command, Native Inspect suspends command prompting until one of the following happens: • The process is transferred back to Native Inspect.
Related Commands • To delete symbols data for a specific file, use the unload-symbol-file Command. • To load a symbol file at a specific address, use the add-symbol-file Command. • To list the symbol files currently loaded, use the info Command with the symbol-files option. For more information, see Optionally Loading Symbols Information (page 34). Example To load a symbol file and display information about the symbol file: (eInspect 4,798): symbol-file $system.sys00.
File \SIERRA.$OS.VIVTEST.
unload-symbol-file Command Unloads all symbol data associated with a specified loadfile name. • Entered with no arguments, prompts you before unloading all symbol data having a per-process scope associated with the current process. • Entered with only the -g option, prompts you before unloading all symbol files having global scope. unload-symbol-file [-g] symbol-file-name Where: -g Unloads a symbol file with global scope.
until [locspec] Where: locspec The location where you want execution to stop. See Syntax of locspec (page 59). If you enter the until command with no arguments, the results are similar to those of the next command, except that at the bottom of a loop the until command steps through all remaining iterations. Examples • To execute until the function returns: (eInspect 1,329): until - building PCBReadyList: 0, 2, 4 379 PCBList_add( &PCBReadyList, PCBList.
(eInspect 7,416): up #1 0x70006950:0 in EMMA () at \SIERRA.$AUDIT.DIVA.CBINIT:136 136 Call “Lisa”. (eInspect 7,416): up #2 0x70003110:0 in MAIN () at \SIERRA.$AUDIT.DIVA.CBINIT:53 53 Call “Emma”. (eInspect 7,416): down #1 0x70006950:0 in EMMA () at \SIERRA.$AUDIT.DIVA.CBINIT:136 136 Call “Lisa”. (eInspect 7,416): down #0 EMMA.LISA () at \SIERRA.$AUDIT.DIVA.CBINIT:155 155 DISPLAY “In Lisa”.
The segment corresponding to segid becomes the current in-use segment (marked with the letter g) for Native Inspect commands. (The current in-use segment for the process itself is marked with the letter p.) If you do not specify a segid, the vq command displays information about the extended segments allocated by the current process. wait Command Instructs Native Inspect to stop prompting and wait for a Debug event to occur or for you to press the Break key.
format The following options are supported: • a – address • c – char • d – signed decimal • f – float • i – instruction • o – octal • s – string • t – binary • u – unsigned decimal • x – hexadecimal size The following options are supported: • b – byte • h – half word (16 bits) • w – word (32 bits) • g – giant (64 bits or 8 bytes) address The address in memory at which you want the display to start.
Examples • To display memory at address 0x70000fc0 and then display three machine instructions starting at that address: (eInspect 7,464): x 0x70000fc0 0x70000fc0:0 : 0x0900cc68 (eInspect 7,464): x /3i 0x70000fc0 0x70000fc0:0 : [MMI] 0x70000fc0:1 : 0x70000fc0:2 : • To display memory at an address: (eInspect 0,794): x /20c 0x70000ca8 0x70000ca8 <__STRING$4>: 109 'm' 'i' 116 't' 111 'o' 0x70000cb0 <__STRING$6>: 102 'f' 'd' 0 '\000' 0 '\000' 0x70000cb8 <__STRI
0x70000cd8 <__STRING$3+24>: 0x70000cde <__STRING$3+30>: 0x70000ce2 <__STRING$4+2>: 0x70000ce8 <__STRING$4+8>: (eInspect 6,1103): x 0x70000ce8 <__STRING$4+8>: NOTE: • [-3-] Note that offsets are specified in hexadecimal.
5 Using Tcl Scripting Introduction to Tcl Native Inspect includes Version 8.5 of the open-source Tool Command Language (Tcl), which enables you to develop macros that can automate debugging operations. You can write Tcl scripts made up of built-in Tcl commands, and you can write your own Tcl commands. Tcl scripts enable you to extend the power and functionality of Native Inspect. Tcl can help you create custom debugging commands suited for a particular domain or application.
• modify command • reg command • tn command Loading a Tcl Script To load a Tcl script, use the Tcl source command. For example, to run the script named myTcl, enter: (eInspect 3,301): tcl source myTcl To run the script, enter the name of the Tcl script at the Native Inspect prompt. Using Variables Defined in a Tcl Script You can use variables defined in a Tcl script, such as $amount, after you run the Tcl script that contains the definition.
# mySub.tcl package provide mySub 1.0 namespace eval ::mySub:: { # my package code } # More code In this example, the namespace ::mySub:: contains the package mySub. When your package is installed on a system, Tcl scripts can use your package by referring to its namespace, not its actual location. It is important to create your packages in your own namespaces to avoid conflicts. Each exported subsystem command must be referenced by namespace.
proc eq { args } { # sanity check if { ! [llength args] } { SYNTAX_ERROR eq } set result [matheval $args] set char [ASCII $result] PUT "\n" PUT "OCT: [format %06o $result] DEC: [format %-5d $result] HEX: 0x[format %04x result] ASCII: \'$char\'\n" } proc empty_str {str} { expr { [scan $str "%s" tmp] == -1 } #------------------------------------------------------------} proc crunch_number {s endnum} { return [string match {[-0-9#%]} [string index $s 0]] } • To create and use a simple Tcl command (allbases):
} } • To use the Tcl script ListPCBs to walk data structure: (eInspect 0,519): tcl source mypcb (eInspect 0,519): ListPCBs 20 Active PCBs pin flags attributes 0 0x6000 7 1 0x0500 0 2 0x6000 0 3 0x0500 0 4 0x6000 0 5 0x0500 0 6 0x0000 0 7 0x0000 0 8 0x0000 0 9 0x0000 0 10 0x0000 0 11 0x0000 0 12 0x0000 0 13 0x0000 0 14 0x0000 0 15 0x0000 0 16 0x0000 0 17 0x0000 0 18 0x0000 0 19 0x0000 0 Tcl Commands Provided by Native Inspect Native Inspect includes the built-in commands that are provided by open-source T
Table 14 Tcl Commands for HP NonStop Systems (continued) Tcl Command Description command passed to the Tcl result buffer. The result might be a single value or multiple values.
A Command Mapping With Debug and Inspect • Table 15 lists Debug commands and equivalent Native Inspect commands. • Table 16 lists Inspect commands and equivalent Native Inspect commands.
Table 16 Inspect Commands and Equivalent Native Inspect Commands Inspect Command Equivalent Native Inspect Command Low-Level Inspect Commands A a (ASCII) B break, tbreak BM mab (memory access breakpoint) C, CM delete, dmab D d (display memory) FC fc (fix command) F NOT SUPPORTED FN fn (find number) HIGH NOT APPLICABLE I i (instructions) M modify, set (variable) P NOT SUPPORTED R continue STOP kill T bt (bt, tn) VQ vq (select segment) ? env (environment) = eq (equals) Hi
Table 16 Inspect Commands and Equivalent Native Inspect Commands (continued) Inspect Command Equivalent Native Inspect Command fa NOT SUPPORTED fb NOT SUPPORTED fc fc (fix command) files NOT SUPPORTED fk NOT SUPPORTED if condition help help, help option history show with commands option hold hold icode disassemble, da identifier ptype info identifier ptype info location NOT SUPPORTED info objectfiles info with dll option info opens NOT SUPPORTED info savefile NOT SUPPORTED
Table 16 Inspect Commands and Equivalent Native Inspect Commands (continued) 138 Inspect Command Equivalent Native Inspect Command out log pause wait program vector resume continue save save scope frame, select-frame select debugger debug switch with INSPECT option select segment vq select language set (environment) with lang option select program vector select source system NOT SUPPORTED select systype NOT SUPPORTED set set (environment), set (variable) show show signals ih
B Redirected and Aliased WDB Debugger Commands The following WDB commands have a corresponding Native Inspect command with the relationship between the commands taking one of the following forms: • A command alias – The WDB and Native Inspect syntax and semantics are identical. You can specify the WDB command and it automatically maps to the corresponding Native Inspect command. • A command redirect – The WDB and Native Inspect syntax and semantics differ but the function is similar.
Index Symbols != (operator), 62 # command, 56, 64 #, in frame number, 69 $, 62, 103 $$, 62, 103 $_, 126, 128 $__, 126, 128 $cdir, 74, 116 $cwd, 74, 116 $SYSTEM.SYSnn.
save snapshot, 28 Command history, 116 Command prompt, 23 command prompt, 23 commands debug-compatible, 17 principal, 33 commands command, 58, 70 commands option, 116 comment command, 56, 71 comparing debuggers, 17 COBOL specifics, 18 Inspect, 17 compatibility of commands, 17 Compilation directory, 74, 116 compiling program files, 34 complaints option, 110 Concatenation operator, COBOL, 53 condition command, 58, 71 Conditional breakpoints, 67 conditional-expression, 71 confirm option, 110 Constant expressio
down-silently command, 58, 78 dynamic-link libraries see DLL E EDIT files, 16 EINSCSTM file, 23, 103 EINSPECT, 17, 18, 22, 103 elements option, 112 emulated TNS processes, 15 enable command, 58, 78 enable display command, 58, 79 enter key, 80, 95, 102, 118, 126 env command, 58, 79 eq command, 56, 79, 105 errors, reporting, 14 event debugging, 30 handling, 31 handling for DLL, 30 events breakpoint, 31 deug, 31 OSS exec, 31 process death, 31 signal, 31 Example session C program, 37 COBOL program, 40 executin
Instruction pointer, 106 invoking Native Inspect, 20 invoking Native Inspect, 19, 22 J jb command, 93 jump command, 57, 93 K key break, 24, 25, 27, 57, 71, 119, 125 enter, 80, 95, 102, 118, 126 kill command, 57, 94 L language option, 111 languages supported, 18 C++, 18 COBOL, 18 pTAL, 18 leaks filename option, 90 leaks leaknumber option, 90 leaks option, 90, 115 lexpr command (Tcl), 133 line option, 87, 88 linespec syntax of see locspec list command, 33, 36, 59, 94 listing DLLs, 28 listsize option, 111,
–debug, 19 options debugging, 15 organization of the document, 11 origin of Native Inspect, 16 OSS, 18, 19 see HP NonStop Open System Services (OSS) starting Native Inspect, 22 OSS exec event, 31 output command, 58, 63, 103 output-radix option, 111 overview Native Inspect, 15 P package provide command (Tcl), 131 package require command (Tcl), 131 pathnames, resolving, 64 pathnames, specifying, 64 PIC, 28 Pointers (pTAL), 62 Pointers, displaying, 105 Position-Independent Code see PIC POSIX threads, 32 Predi
set heap-check command (memory leak detection), 59, 115 set language ptal command, 62 setting breakpoints DLLs, 29 sevenbit-strings option, 112 show command, 57, 80, 116 show directories command, 74 show heap-check command (memory leak detection), 59 show user command (user-defined), 59 signal events, 31 signal event, 31 Signal handlers, 100 Signal names, 100, 101 signals option, 87 snapshot considerations when debugging, 28 opening, 28 server, 28 snapshot command, 28, 57, 117 Snapshot file, 28 snapshot fil
value option, 62 Variable addresses, displaying, 105 variables option, 88 Variables, modifying, 107 vector command, 25, 32, 57, 124 verbose option, 113 version, 16 version option, 56, 57, 117, 124 Visual Inspect, 15, 25, 31 volume command, 70 vq command, 59, 124 vtable option, 112 W wait command, 25, 27, 57, 125 warranty option, 88, 117 WDB, 16 differences with Native Inspect, 32 whatis command, 59, 125 which command, 57, 125 width option, 113 Working directory, 108 working directory see current working di