NonStop Development Environment for Eclipse 4.0 Debugging Supplement HP Part Number: 732675-001 Published: October 2013 Edition: NSDEE 4.0, J06.03 and subsequent J-series RVUs, H06.
© Copyright 2011, 2013 Hewlett-Packard Development Company, L.P. Confidential computer software. Valid license from HP required for possession, use or copying. Consistent with FAR 12.211 and 12.212, Commercial Computer Software, Computer Software Documentation, and Technical Data for Commercial Items are licensed to the U.S. Government under vendor’s standard commercial license. Export of the information contained in this publication may require authorization from the U.S. Department of Commerce.
Contents 1 Introduction...............................................................................................6 Introducing the debugging features for the NonStop Development Environment for Eclipse..................6 New and changed features for NSDEE 4.0.............................................................................7 2 Debugging tasks........................................................................................8 Preparing to debug a NonStop Application.....................
Setting watch expressions...................................................................................................33 Related topics...............................................................................................................34 Setting breakpoints............................................................................................................34 Related topics...............................................................................................................
Figures 1 2 3 4 5 6 7 8 9 10 11 12 13 Sample variables view for optimized application....................................................................9 Debug configurations dialog with main tab for NonStop Application debug configurations.......13 Arguments tab for NonStop Application debug configurations...............................................16 Environment tab for NonStop Application debug configurations, Guardian launch type.............
1 Introduction Introducing the debugging features for the NonStop Development Environment for Eclipse The debugging features for the NonStop Development Environment Version 4.0 for Eclipse (NSDEE) allow you to debug NonStop TNS/E applications developed using NSDEE as well as applications developed outside of NSDEE, attach the debugger to a running process, and debug Snapshot files.
New and changed features for NSDEE 4.0 Product changes for NSDEE 4.0 include: • Upgrade to Eclipse Juno 4.2. CDT 8.1, and Debugging Services Framework (DSF-GDB) • Support for Windows XP SP3, Windows 7 x86/x64, and Windows 8 x86/64 • Support for Java 6 (JRE 1.6) and Java 7 (JRE 1.
2 Debugging tasks Preparing to debug a NonStop Application The standard process to prepare to debug a NonStop Application is: • Create a NonStop Local project or NonStop Remote project for the application NOTE: Eclipse workspaces are containers for organizing a set of related projects.
Figure 1 Sample variables view for optimized application In addition to the messages shown in the Variables view, you might see messages similar to these in the Native Inspect (eInspect) console in the Console view: Value is not available at current location Due to optimization, the address/value of "total" is unknown for the current location.
Related topics Related tasks: • “Creating a new NonStop Application debug configuration” (page 12) • “Modifying an existing NonStop Application debug configuration” (page 14) • “Attaching the debugger to a NonStop process” (page 10) • “Debugging a Snapshot file” (page 11) • “Using the debug perspective for NonStop Applications” (page 32) Related reference topics: • “Debug configurations dialog for NonStop debugging configurations” (page 40) • “Debug perspective for NonStop debugging configurati
Related reference topics: • “Debug configurations dialog for NonStop debugging configurations” (page 40) • “Debug perspective for NonStop debugging configurations” (page 39) Debugging a Snapshot file A process Snapshot file or Snapshot is a disk file that is an image of a process, its data, and its status at the moment it was saved. Snapshot files are analogous to core files on UNIX systems. Snapshot files have file code 130.
Related topics Related tasks: • “Attaching the debugger to a NonStop process” (page 10) • “Ending a debugging session” (page 38) Related reference topics: • “Debug perspective for NonStop debugging configurations” (page 39) • The discussion of Debug views in the C/C++ Development User Guide. (Available from the Eclipse Workbench help menu. Select Help→Help Contents.
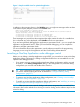
1. Open the Debug Configurations dialog (Figure 2). For example, from the main toolbar, select Run→Debug configurations. Figure 2 Debug configurations dialog with main tab for NonStop Application debug configurations 2. The list in the left side of the Debug Configurations dialog shows the types of debug configurations you can create in addition to the names of debug configurations that have already been created in this workspace. In this list, double-click the NonStop Application configuration type.
b. c. d. e. 5. 6. For NonStop project:, specify the NonStop development project that was used to build the application. Enter the name of the project in the box or click Browse... to locate and select the project using the “Project selection dialog” (page 42). This is optional for applications built outside of NSDEE. For NonStop system: specify the system on which to run the application.
3. 4. If you want to change the name of this configuration, enter the new name in the Name: box. Make the modifications you want in each of the tabs. When you finish entering the information for each tab, click Apply to apply your changes or Revert to revert to the settings in effect the last time changes were applied, or go on to the next tab and click Apply when you are ready to apply your changes to all tabs.
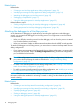
Figure 3 Arguments tab for NonStop Application debug configurations 16 Debugging tasks
1. To specify arguments for the run command used to launch the application under debugger control, enter them in the box below Run command options (newlines treated as spaces):. The syntax used for these arguments must be valid for the option selected for NonStop launch type: in the Main tab; either OSS or Guardian. For the Guardian launch type, you are not required to use opening and closing forward slashes. NSDEE does not validate this syntax.
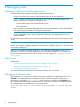
Specifying DEFINEs, ASSIGNS, and PARAMs for Guardian launch types You can specify DEFINEs, ASSIGNS, and PARAMs for Guardian launch types using the Environment tab (Figure 4 (page 18)) of the Debug Configurations dialog. These settings are used for this debug configuration only (they are not stored in your TACLCSTM file, for example). • To specify DEFINEs, ASSIGNS, and PARAMs manually, select Set the following DEFINEs, ASSIGNs, and PARAMs: and enter them in the box.
Specifying environment variables for OSS launch types You can specify OSS environment variables for OSS launch types using the Environment tab (Figure 5 (page 20)) of the Debug Configurations dialog. These environment variables are used only for the shell session used with this debug configuration (they are not stored in your .profile file, for example).
Figure 5 Environment tab for NonStop Application debug configurations, OSS launch type NonStop Attach Process debug configurations Creating a new NonStop Attach Process debug configuration 1. 2. Open the Debug Configurations dialog. For example, from the main toolbar, select Run→Debug configurations.
Figure 6 Main tab for NonStop Attach Process debug configurations 3. 4. In the Name: box, enter a name for this debug configuration, or use the default name, New_configuration. In the Main tab, configure these settings: a. For NonStop launch type: select Guardian if your application is a Guardian application or select OSS if your application is an OSS application. b. For NonStop project:, specify the NonStop development project that was used to build the application.
d. For NonStop CPU and process ID number (CPU, PIN):, specify the process you want to debug. Enter the processor number in the first box and the process ID number (PIN) in the second box, or click Browse... to select a process. If you click Browse...: • If you selected the Guardian NonStop launch type, the version of the Process Browser dialog in Figure 7 (page 22) appears.
To select a process, click in the row that contains the process, then click OK. The process CPU and PIN are displayed in the boxes in the Main tab of the Debug Configurations dialog, and the Process Browser dialog closes. 5. 6. 7. 8. If you want to specify options for the debugger, enter the information in the Debugger tab. See “Specifying debugger options” (page 30). By default, the debugger searches for source files at the path recorded when the application was compiled.
3. 4. If you want to change the name of this configuration, enter the new name in the Name: box. Make the modifications you want in each of the tabs. When you finish entering the information for each tab, click Apply to apply your changes or Revert to revert to the settings in effect the last time changes were applied, or go on to the next tab and click Apply when you are ready to apply your changes to all tabs.
3. 4. In the Name: box, enter a name for this debug configuration. In the Main tab (Figure 9 (page 25)), configure these settings: a. For NonStop launch type: select either Guardian or OSS. Your selection determines what types of remote paths are allowed in all the tabs of the Debug Configuration dialog and all of the dialogs related to browsing the remote system. b. For NonStop project:, specify the NonStop development project that was used to build the application.
6. 7. 8. By default, the debugger searches for source files at the path recorded when the application was compiled. If you need to specify a different location, such as when you have moved the files to a different system, use the Source tab to specify the current location of the files. A rule must be specified, either the default or alternate locations. See “Specifying alternate source file locations” (page 27). The Common tab allows you to set other options related to the Eclipse workspace.
Related topics Related tasks: • “Creating or modifying debug configurations” (page 12) Related reference topics: • “Debug configurations dialog for NonStop debugging configurations” (page 40) Tasks common to all debug configurations Listing and filtering debug configurations To filter the list of debug configurations shown in the configuration list in the Debug Configurations dialog (Figure 2 (page 13)), use any of these methods: • Use the filter box to specify text that must be included in the name of
Figure 10 Source tab The box for Source Lookup Path: contains the list of the categories of rules that have been configured for this debug configuration. Initially only the default rule is configured. The default rule is: • For NonStop Remote projects and applications built on NonStop servers outside of NSDEE, a Remote Compile-Time File Path, which specifies that the debugger looks for source files on a remote system using compile-time paths. Figure 10 shows an example for a remote project.
Adding source lookup paths To add an entry to the Source Lookup Path: list in the Source tab, click the Add... button to the right of the list. The Add Source dialog appears. From this dialog, you can select and add any of the six types of source lookup rules listed in the dialog. Choose which type of rule you want to add: To look for source files in this location... Select this rule type and click OK The local compile-time location.
2. Add one or more path mappings to the container: a. Select the path mapping container (by default, named either Local Path Mapping: New Mapping or Remote Path Mapping: New Mapping). b. Click Edit.... Depending on the type of mapping you selected, either the Local Path Mappings dialog or the Remote Path Mappings dialog appears. c. (Optional) Change the name of the mapping container by editing the Name: box. d. Click Add.... If you chose a local path mapping, the Local Path Mapping dialog appears.
Figure 11 Debugger tab • The Use default debugger option is selected by default. To use a different debugger than the default debugger (for example, you have installed a different version of the debugger in another location), select Use debugger at the following path: and enter the path in the box or click Browse... to locate and select the debugger you want to use. • (NonStop Application debug configurations only) By default, Stop at main entry point after launch is selected.
Related topics Related tasks: • “Creating or modifying debug configurations” (page 12) Related reference topics: • “Debugger tab” (page 45) Using the debug perspective for NonStop Applications The Debug perspective for NonStop Applications, Snapshot files, and processes is an extension of the C/C++ Development Toolkit (CDT), and is nearly identical to the CDT Debug perspective. For a brief description of the key differences, see “Debug perspective for NonStop debugging configurations” (page 39).
information about this task, see the C/C++ Development User Guide. (Available from the Eclipse Workbench help menu. Select Help→Help Contents.) Related topics Related reference topics: • “Debug perspective for NonStop debugging configurations” (page 39) See also the C/C++ Development User Guide. (Available from the Eclipse Workbench help menu. Select Help→Help Contents.
NOTE: Watch expressions are associated with your Eclipse workspace, not with a particular project. Consequently, if you debug multiple projects in the same workspace, errors can be reported if an expression in your workspace is not valid for the project you are debugging. HP recommends that you clear all watch expressions before you debug a different program in the same workspace. In addition, you can configure multiple Eclipse workspaces and use a workspace for each set of related projects.
NOTE: Casting a variable to a different type is supported for C/C++ applications only. Do not attempt to use NSDEE to cast a variable to a different type in COBOL or pTAL applications. For pTAL variables, you can cast integer variables to ASCII values by entering the print /c command in the Native Inspect console. For example: > print /c gstartup_message.
Related topics Related tasks: • “Inspecting and modifying variable values” (page 34) • “Inspecting and modifying memory” (page 36) • “Specifying debugger options” (page 30) Related reference topics: • “Debug perspective for NonStop debugging configurations” (page 39) • “Debugger tab” (page 45) See also the C/C++ Development User Guide. (Available from the Eclipse Workbench help menu. Select Help→Help Contents.
For a list of the Native Inspect commands supported by NSDEE, see “Native Inspect commands supported by NSDEE” (page 49).
Related topics Related tasks: • “Entering Native Inspect commands from the console view” (page 36) Related reference topics: • “Debug perspective for NonStop debugging configurations” (page 39) Ending a debugging session The debugging session ends when one of these conditions occurs: • The application or process being debugged terminates.
3 Reference information Debug perspective for NonStop debugging configurations The Debug perspective for NonStop Applications, Snapshot files, and processes is an extension of the C/C++ Development Toolkit (CDT), and is nearly identical to the CDT. Figure 12 (page 32) shows an example of the Debug perspective for NonStop debugging.
• The Executables view is not supported. • In the Variables, Registers , or Expressions views, casting a register or variable to a different type is supported for C/C++ applications only. • The Signals view is not supported. Instead, you can use ih and mh commands, which have similar capabilities, in the in the Native Inspect (eInspect) console. • The Registers view displays register values for the current program execution point.
A NonStop debug configuration has the NonStop icon NonStop debug configurations are: • NonStop Application • NonStop Attach Process as its label decoration. The types of • NonStop Snapshot For more information about these debug configurations, see the “Debug configurations dialog for NonStop debugging configurations” (page 40). Component Description Filter text box Restricts the list of debug configurations shown to those that have names containing the text that is entered in the box.
Component Description Debugger tab Specifies which debugger to use and provides debugger options. Source tab Specifies how to search for source files. Common tab Specifies other configuration information, such as where to save the configuration. Main tab Use the Main tab to provide information about the remote application to be debugged and about the remote system on which debugging will occur.
To access this dialog, click Browse... next to a NonStop project: box, such as in the Main tab of the Debug Configurations dialog. Component Description Project filter: Allows you to can constrain the search by entering a name or partial project name in the box. Choose a project: Lists the available projects: • Click the name of the project once to select it. • Click the name of the project twice to select it and close the dialog. OK Applies your selection and closes the dialog.
Component Description option, the application and debugger are run in a processor that is chosen by the system. Program arguments Specifies the arguments to be passed to the application. (newlines treated as spaces): Set working directory: When selected, specifies a directory other than the default working directory (your home directory). Enter the full path and name of the working directory in the box or click the Browse... button to locate and select the working directory.
Environment tab for Guardian launch types When the Guardian launch type is selected in the Main tab, these are the components of the Environment tab (Figure 4 (page 18)): Component Description Set the following DEFINEs, ASSIGNs, and PARAMs: When selected, specifies to set the DEFINEs, ASSIGNs, and PARAMs listed in the box. Set DEFINEs, ASSIGNs, and PARAMs contained in remote file: When selected, specifies that the debugger use the obey command to execute the commands in the file specified in the box.
The Debugger tab is available in the Debug Configurations dialog. Component Description Use default debugger When selected, specifies that the default debugger for remote NonStop system be used. This is the default option. Use debugger at the following path: When selected, specifies to use the debugger specified in the box instead of the default debugger. Enter the path in the box or click Browse... to locate and select the debugger you want to use.
Table 1 Source lookup rules in add source dialog Component Local Compile-Time File Path Local Directory Local Path Mapping Remote Compile-Time File Path Remote Directory Remote Path Mapping Description When selected, specifies that the debugger look for source files at their local compile-time location. This is the default rule for applications built locally either in NSDEE or outside of NSDEE.
This dialog appears when you select a Source File Lookup Path entry and click Edit... from the Source tab of the Debug Configurations dialog. The Path Mappings dialog is identical for both local and remote path mappings. Component Description Name: Specifies the name to use for this path mapping entry in the Source Lookup Path list. The default name is New Mapping. Enter a name for this entry in the box. Add...
The Common tab is part of Eclipse Workbench. For NonStop Application debug configurations only, a Run option is included under Display in favorites menu. Run and debug favorites are launches that are listed directly in: • The Run menu of the main menu bar. • The shortcut lists of the Debug item in the main tool bar. • The shortcut lists of the Run item in the main tool bar.
NonStop icons and buttons In addition to the icons and buttons that can be displayed by the Workbench and NSDEE, these icons and buttons can be displayed in workspaces that have installed NonStop debugging features: Icon or Button Description NonStop Local perspective NonStop Remote perspective NonStop debug configuration NonStop Snapshot file Local compile-time file path Local directory Local path mapping Remote compile-time file path Remote directory Remote path mapping 50 Reference information
4 Support and other resources Supported Release Version Updates (RVUs) This document supports: • NSDEE 4.0 and all subsequent versions of NSDEE until otherwise indicated in a replacement publication • The Native Inspect (eInspect) debugger in J06.03 and all subsequent J-series RVUs and H06.
Technical support For NonStop-specific issues, contact HP support at: http://www8.hp.com/us/en/contact-hp/contact.html Report any Eclipse-specific issues to the Eclipse website at: http://www.eclipse.org/org/foundation/contact.
Index A Add File System Directory dialog, 47 Add Source dialog, 29, 46 amap command, 49 application console, 37 Arguments tab of Debug Configurations dialog, 15, 43 ASSIGNs specifying for Guardian applications, 18, 45 using in a command file, 18, 45 B break command, 49 breakpoints for NonStop Applications, 34 fractional line numbers, 34 C C and C++ applications, debugging, 6 catch abend command, 49 catch load command, 49 catch stop command, 49 catch unload command, 49 CDT, 6 documentation, 6 COBOL applica
EINSCSTM file, 36 supported commands, 49 versions supported, 51 NonStop Application debug configurations debugging options, 30 NonStop Applications alternate source file locations, 27 breakpoints for, 34 casting registers to a different type, 35, 40 casting variables, 35 considerations for memory, 36 considerations for register values, 35 considerations for variable values, 34 controlling the execution of, 33 debugging C or C++ applicatons, 6 debugging COBOL applicatons, 6 debugging Java applicatons, 6 debu
help, accessing, 6 55