
NonStop Development Environment for Eclipse 4.0 Debugging Supplement

Related topics
Related tasks:
• “Creating or modifying debug configurations” (page 12)
Related reference topics:
• “Debugger tab” (page 45)
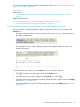
Using the debug perspective for NonStop Applications
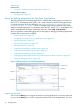
The Debug perspective for NonStop Applications, Snapshot files, and processes is an extension
of the C/C++ Development Toolkit (CDT), and is nearly identical to the CDT Debug perspective.
For a brief description of the key differences, see “Debug perspective for NonStop debugging
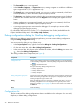
configurations” (page 39). Figure 12 shows an example of the Debug perspective being used to
debug a NonStop Application. For information about the CDT, see the C/C++ Development User
Guide. (Available from the Eclipse Workbench help menu. Select Help→Help Contents.)
This topic describes common debugging tasks as they apply to debugging NonStop Applications,
Snapshot files, and processes, including:
• “Inspecting the stack” (page 32)
• “Controlling the execution of a NonStop Application” (page 33)
• “Setting watchpoints” (page 33)
• “Setting watch expressions” (page 33)
• “Setting breakpoints” (page 34)
• “Inspecting and modifying variable values” (page 34)
• “Inspecting and modifying register values” (page 35)
• “Inspecting and modifying memory” (page 36)
• “Debugging NonStop Applications using Native Inspect (eInspect) commands” (page 36)
• “Ending a debugging session” (page 38)
Figure 12 Debug perspective for NonStop Applications
Inspecting the stack
You can use the Debug view to inspect the stack for NonStop Applications in the same ways that
you can use the Debug view in CDT to inspect the stack for other kinds of applications. For more
32 Debugging tasks