
NonStop Development Environment for Eclipse 4.0 Debugging Supplement
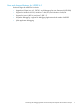
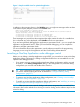

Figure 1 Sample variables view for optimized application
In addition to the messages shown in the Variables view, you might see messages similar to these
in the Native Inspect (eInspect) console in the Console view:
Value is not available at current location
Due to optimization, the address/value of "total" is unknown for the current location.
Closest location(s) where it is available:
1) 0x70000e92 to 0x70000ea0 (in line 34) in register $r40
2) 0x70000ea1 to 0x70000ed0 (in line 35) in register $r8
3) 0x70000ef1 to 0x70000f31 (in line 38 to 40) in register $r25
These messages can provide hints about registers that might contain the value of a variable that
has a value that can not be displayed in the Variables view due to optimization.
If you are having difficulty debugging the application at optimization level 1, you can compile the
application at optimization level 0. When you have finished debugging, you can compile the
application at higher optimization levels.
For more information about code optimization, see the reference manual for the programming
language you are using for this application and the Code Profiling Utilities Manual.
Launching a NonStop Application under debugger control
Before you can debug a NonStop Application using NSDEE, you must select or create a NonStop
Application debug configuration. A debug configuration defines how an executable file is to be
opened under debugger control.
• If you want to reuse an existing NonStop Application debug configuration and do not need
to modify it, in the Debug Configurations dialog, in the configurations list, select the debug
configuration you want use and double-click to launch it.
TIP: If the configurations list contains a large number of debug configurations, find the one
you want to select by filtering the results as described in “Listing and filtering debug
configurations” (page 27).
• To create a new NonStop Application debug configuration, see “Creating a new NonStop
Application debug configuration” (page 12).
• To modify an existing NonStop Application debug configuration, see “Modifying an existing
NonStop Application debug configuration” (page 14).
NOTE: Often you can access wizards, dialogs, and actions using more than one method. For
information about other methods for accessing a wizard or dialog, see the reference topic for that
wizard or dialog.
Launching a NonStop Application under debugger control 9