NonStop Development Environment for Eclipse Debugging Supplement HP Part Number: 580258-002 Published: February 2011 Edition: NSDEE 2.1, J06.03 and subsequent J-series RVUs, H06.03 and subsequent H-series RVUs, and G06.
© Copyright 2011 Hewlett-Packard Development Company, L.P. Confidential computer software. Valid license from HP required for possession, use or copying. Consistent with FAR 12.211 and 12.212, Commercial Computer Software, Computer Software Documentation, and Technical Data for Commercial Items are licensed to the U.S. Government under vendor’s standard commercial license. Export of the information contained in this publication may require authorization from the U.S. Department of Commerce.
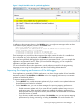
Contents 1 Introduction...............................................................................................6 Introducing the debugging features for the NonStop Development Environment for Eclipse..................6 Related topics......................................................................................................................6 2 Debugging Tasks........................................................................................8 Preparing to debug a NonStop application....
Related topics...............................................................................................................34 Setting watchpoints............................................................................................................34 Related topics...............................................................................................................34 Setting watch expressions...................................................................................................
Related Information.................................................................................................................52 Publishing History...................................................................................................................52 HP Encourages Your Comments................................................................................................52 Index.........................................................................................................
1 Introduction Introducing the debugging features for the NonStop Development Environment for Eclipse The debugging features for the NonStop Development Environment Version 2.1 for Eclipse (NSDEE) allow you to debug NonStop TNS/E applications developed using NSDEE, attach the debugger to a running process, and debug snapshot files. The features described in this document are extensions to the Eclipse Workbench, the C/C++ Development Toolkit (CDT), and the NonStop Development Environment Version 2.
Related reference topics: • “Debug perspective for NonStop debugging configurations” (page 39) • “Debug Configurations dialog for NonStop debugging configurations” (page 40) • “NonStop Icons and Buttons” (page 50) • “Support and other resources” (page 52) See also the Native Inspect Manual in the NonStop Technical Library and these documents, available from the Eclipse Workbench help menu: • NonStop Development Environment for Eclipse User Guide • Workbench User Guide • C/C++ Development User Gui
2 Debugging Tasks Preparing to debug a NonStop application Before you can debug a NonStop application, you must: • Create a NonStop Local project or NonStop Remote project for the application NOTE: Eclipse workspaces are containers for organizing a set of related projects.
Figure 1 Sample Variables view for optimized application In addition to the messages shown in the Variables view, you might see messages similar to these in the Native Inspect (einspect) console in the Console view: Value is not available at current location Due to optimization, the address/value of "total" is unknown for the current location.
when you are not using it. NSDEE does not update a view if that view is not visible to the user. When automatic updates are disabled, you have these options for viewing the values of variables : • Enable updates for a specific variable by selecting it the Variables view, right-clicking, and selecting Enable from the pop-up menu. • Use the Expressions view to display the variables you are interested in monitoring.
• “Debugging a snapshot file” (page 12) • “Using the Debug perspective for NonStop applications” (page 32) Related reference topics: • “Debug Configurations dialog for NonStop debugging configurations” (page 40) • “Debug perspective for NonStop debugging configurations” (page 39) Attaching the debugger to a NonStop process As an alternative to debugging an application by launching the application under debugger control, you can attach the debugger to a NonStop process.
Debugging a snapshot file A process snapshot file or snapshot is a disk file that is an image of a process, its data, and its status at the moment it was saved. Snapshot files are analogous to core files on UNIX systems. Snapshot files have file code 130. The ability to examine a snapshot file can be useful when a process terminates abnormally and you want to determine the circumstances in effect at the time of the termination.
• “Attaching the debugger to a NonStop process” (page 11) • “Ending a debugging session” (page 38) Related reference topics: • “Debug perspective for NonStop debugging configurations” (page 39) • The discussion of Debug views in the C/C++ Development User Guide.
2. The list in the left side of the Debug Configurations dialog shows the types of debug configurations you can create in addition to the names of debug configurations that have already been created in this workspace. In this list, double-click the NonStop Application configuration type. A new debug configuration appears below the debug configuration type with the default name New_configuration.
files to a different system, use the Source tab to specify the current location of the files. See “Specifying alternate source file locations” (page 28). 9. The Common tab allows you to set other options related to the Eclipse workspace. For information about this tab, see “Common tab for NonStop debug configurations” (page 49). 10. If you have not already done so for each tab, click Apply to apply your changes. To revert to the settings in effect the last time changes were applied, click Revert.
Related topics Related tasks: • “Creating or Modifying Debug Configurations” (page 13) Related reference topics: • “Debug Configurations dialog for NonStop debugging configurations” (page 40) Specifying arguments for NonStop Application debug configurations You use the Arguments tab (Figure 3) to specify options to be used by the run command when your program is launched, arguments to pass to the application, and to specify a working directory other than your home directory.
1. To specify arguments to be used for the run command that is used to launch the application under debugger control, type them in the box below Run command options (newlines treated as spaces):. The syntax used for these arguments must be valid for the option selected for NonStop launch type: in the Main tab; either OSS or Guardian. For the Guardian launch type, you are not required to use opening and closing forward slashes. NSDEE does not validate this syntax.
Specifying DEFINEs, ASSIGNS, and PARAMs for Guardian launch types You can specify DEFINEs, ASSIGNS, and PARAMs, for Guardian launch types using the Environment tab (Figure 4 (page 18)) of the Debug Configurations dialog. These settings are used for this debug configuration only (they are not stored in your TACLCSTM file, for example). • To specify DEFINEs, ASSIGNS, and PARAMs, manually, select Set the following DEFINEs, ASSIGNs, and PARAMs: and type them in the box.
Specifying environment variables for OSS launch types You can specify OSS environment variables for OSS launch types using the Environment tab (Figure 5 (page 20)) of the Debug Configurations dialog. These environment variables are used only for the shell session used with this debug configuration (they are not stored in your .profile file, for example).
Figure 5 Environment tab for NonStop Application debug configurations, OSS launch type NonStop Attach Process Debug Configurations Creating a new NonStop Attach Process debug configuration 1. 2. 20 Open the Debug Configurations dialog. For example, from the main toolbar, select Run→Debug configurations.
TIP: If you already have configured another NonStop Attach Process debug configuration, you can copy it and modify the copy to create your new NonStop Attach Process debug configuration. Figure 6 Main tab for NonStop Attach Process debug configurations 3. 4. In the Name: box, type a name for this debug configuration, or use the default name, New_configuration. In the Main tab, configure these settings: a.
d. For NonStop CPU and process ID number (CPU, PIN):, specify the process you want to debug. Enter the processor number in the first box and the process ID number (PIN) in the second box, or click Browse... to select a process. If you click Browse...: • If you selected the Guardian NonStop launch type, the version of the Process Browser dialog in Figure 7 (page 22) appears.
To select a process, click in the row that contains the process, then click OK. The process CPU and PIN are displayed in the boxes in the Main tab of the Debug Configurations dialog, and the Process Browser dialog closes. 5. 6. 7. 8. If you want to specify options for the debugger to use, type the information in the Debugger tab. See “Specifying debugger options” (page 31). By default, the debugger searches for source files at the path recorded when the application was compiled.
TIP: If the configurations list contains a large number of debug configurations, you can find the one you want to select more easily by filtering the results as described in “Listing and filtering debug configurations” (page 27). 3. 4. If you want to change the name of this configuration, type the new name in the Name: box. Make the modifications you want in each of the tabs.
TIP: If you already have configured another NonStop Snapshot debug configuration, you can copy it and modify the copy to create your new NonStop Snapshot debug configuration. 3. 4. In the Name: box, type a name for this debug configuration. In the Main tab (Figure 9 (page 26)), configure these settings: a. For NonStop launch type: select either Guardian or OSS.
Figure 9 Main tab for NonStop Snapshot debug configurations 5. 6. 7. 8. If you want to specify options for the debugger to use, type the information in the Debugger tab. See “Specifying debugger options” (page 31). By default, the debugger searches for source files at the path recorded when the application was compiled. If you need to specify a different location, such as when you have moved the files to a different system, use the Source tab to specify the current location of the files.
2. In the Debug Configurations dialog, in the configurations list, select the debug configuration you want to modify. TIP: If the configurations list contains a large number of debug configurations, you can find the one you want to select more easily by filtering the results as described in “Listing and filtering debug configurations” (page 27). 3. 4. If you want to change the name of this configuration, type the new name in the Name: box. Make the modifications you want in each of the tabs.
Related topics Related tasks: • “Creating or Modifying Debug Configurations” (page 13) Related reference topics: • “Configurations list” (page 40) Deleting an existing debug configuration To delete an existing debug configuration shown in the configuration list in the Debug Configurations dialog (Figure 2 (page 13)), use any of these methods: • Click the debug configuration to select it, then click • Right-click the debug configuration and select Delete. (Delete).
NOTE: In most cases, the default path is the correct path. You only change entries in the Source tab if you have moved the source files since the application was compiled. Figure 10 Source tab The box for Source Lookup Path: contains the list of the categories of rules that have been configured for this debug configuration. Initially only the default rule is configured.
• Lookup on same system as launch (see Main tab), when selected, specifies that the debugger look for the files on the same system as specified for the debugging configuration on the Main tab. • Lookup on system:, when selected, specifies that the debugger look for the files on the system specified in the box. To specify a system, select the system in drop-down list or click Edit... to specify a different system than those shown in the list.
1. Create a container for the path mapping entries: a. To the right of the Source Lookup Path: list, click Add.... The Add Source dialog appears. b. Select either Local Path Mapping or Remote Path Mapping c. Click OK. 2. Add one or more path mappings to the container: a. Select the path mapping container (by default, named either Local Path Mapping: New Mapping or Remote Path Mapping: New Mapping). b. Click Edit....
Figure 11 Debugger tab • The Use default debugger option is selected by default. To use a different debugger than the default debugger (for example, you have installed a different version of the debugger in another location), select Use debugger at the following path: and type the path in the box or click Browse... to locate and select the debugger you want to use. • (NonStop Application debug configurations only) By default, Stop at main entry point after launch is selected.
debug a NonStop application. For information about the CDT, see the C/C++ Development User Guide.
Considerations for NonStop Attach Process debug configurations For NonStop Attach Process debug configurations, selecting Run→Terminate or the terminate icon terminates the process to which you attached the debugger. To release the process from debugger control and allow the process to continue executing, select Run→Disconnect or, in the Debug view, click (Disconnect). • Before disconnecting the debugger from the process, clear all breakpoints in the process and continue process execution.
Setting breakpoints You set and edit breakpoints for NonStop applications in the same ways that you can set breakpoints in the CDT for other types of applications. For information about breakpoints, see the C/C++ Development User Guide. NOTE: Breakpoints are associated with your Eclipse workspace, not with a particular project. Consequently, if you debug multiple projects in the same workspace, errors can be reported if a breakpoint in your workspace is not valid for the project you are debugging.
• “Specifying debugger options” (page 31) • “Improving the stepping performance of the debugger” (page 9) • “Debugging optimized code” (page 8) Related reference topics: • “Debug perspective for NonStop debugging configurations” (page 39) • “Debugger tab” (page 46) See also the C/C++ Development User Guide.
Debugging NonStop applications using Native Inspect (einspect) commands In addition to the debugging tasks you can perform using the Debug perspective, you can use the Native Inspect (einspect) console in the Console view to enter a limited set of Native Inspect debugging commands. For a list of supported Native Inspect commands, see “Native Inspect commands supported by NSDEE” (page 50). NOTE: NSDEE ignores the Native Inspect configuration file (EINSCSTM).
To switch between the consoles, in the Console view, use one of these methods: • Click • Select the console you want to display from the Console view menu: • Select the Native Inspect (einspect) console by clicking the Native Inspect node in the Debug view (see Figure 13 (page 39)). • Select the application console by clicking the application node in the Debug view (see Figure 13 (page 39)). (Console) in the upper right corner of the Console view. .
3 Reference Information Debug perspective for NonStop debugging configurations The Debug perspective for NonStop applications, snapshot files, and processes is an extension of the C/C++ Development Toolkit (CDT), and is nearly identical to the CDT. Figure 12 (page 33) shows an example of the Debug perspective for NonStop debugging.
• The Registers view displays register values for the current program execution point. Selecting a frame on the call stack does not cause the Registers view to display the registers for that frame. • Setting watchpoints is not supported. Instead, you can use the mab command, which has similar capabilities, in the Native Inspect (einspect) console. • A running program process cannot start the debugger. For example you cannot call the debugger program from the process.
For more information about these debug configurations, see the “Debug Configurations dialog for NonStop debugging configurations” (page 40). Component Description Filter text box Restricts the list of debug configurations shown to those that have names that contain the text that is typed in the box. For example, typing Non or NonStop in the box results in a list that includes only the NonStop debug configurations. Click the box.
Main tab Use the Main tab to provide information about the remote application to be debugged and about the remote system on which debugging will occur. shows the Main tab as it appears for NonStop Application debug configurations. The Main tab appears for these NonStop debug configurations: • Figure 2 (page 13) shows the Main tab as it appears for NonStop Application debug configurations. • Figure 6 (page 21) shows the Main tab as it appears for NonStop Attach Process debug configurations.
You access this dialog when you click Browse... next to a NonStop project: box, such as in the Main tab of the Debug Configurations dialog. Component Description Project filter: Allows you to can constrain the search by typing a name or partial project name in the box. Choose a project: Lists the available projects: • Click the name of the project once to select it. • Click the name of the project twice to select it and close the dialog. OK Applies your selection and closes the dialog.
This tab is shown for NonStop Application debug configurations only. Component Description Run command options Specifies the arguments to be used by the run command that is used launch the NonStop (newlines treated as spaces): application under debugger control: • You must not use the debug, nowait, or term option as a run command argument. If you use this option, an error is posted at the top left of the Debug configurations dialog and the Debug button is disabled.
The contents of this tab depend on whether the Guardian or the OSS type is selected in the Main tab: • “Environment tab for Guardian launch types” (page 45) • “Environment tab for OSS launch types” (page 45) Environment tab for Guardian launch types When the Guardian launch type is selected in the Main tab, these are the components of the Environment tab (Figure 4 (page 18)): Component Description Set the following DEFINEs, ASSIGNs, and PARAMs: When selected, specifies that the DEFINEs, ASSIGNs, and
NOTE: Enter environment variables exactly as you would set them in a shell. For example, if you set the environment variable TESTMODE by typing: TESTMODE=1 your setting will not be available to your application. Instead, you must type: export TESTMODE=1 NSDEE does not validate this syntax. Debugger tab The Debugger tab (Figure 11 (page 32)) allows users to set debugger options. The Debugger tab is available in the Debug Configurations dialog.
NOTE: Automatic updates of the Variables and Modules views slow stepping performance. When automatic updates are enabled, the stepping performance is most impacted when you step into a function, because that is when the initial local variable list for the function is created. To improve stepping performance, see “Improving the stepping performance of the debugger” (page 9) Source tab Use the Source tab to configure where to search for source files for applications that are under debugger control.
Table 1 Source lookup rules in Add Source dialog (continued) Component Remote Compile-Time File Path Remote Directory Remote Path Mapping Description When selected, specifies that the debugger look for source files at their remote compile-time location. This is the default rule for remote NonStop projects. If you select this entry and click OK, the entry you selected is added to the list of source lookup paths shown in the Source tab.
Component Description Edit... Opens either the Local Path Mapping or the Remote Path Mapping dialog so that you can modify the path mapping for the highlighted entry. This button is active when you select a path mapping in the list. Remove Removes the highlighted entry from the list. OK Saves all changes and closes the dialog. Cancel Closes the dialog without saving changes.
These favorites allow you to initiate a debugging session or run a application and bypass both the Run Configurations and the Debug Configurations dialogs. For more information about the Common tab, see the Workbench User Guide.
Icon or Button Description NonStop snapshot file Local compile-time file path Local directory Local path mapping Remote compile-time file path Remote directory Remote path mapping NonStop Icons and Buttons 51
4 Support and other resources Supported Release Version Updates (RVUs) This document supports: • NSDEE 2.1 and all subsequent versions of NSDEE until otherwise indicated in a replacement publication • The Native Inspect (einspect) debugger in J06.10 and all subsequent J-series RVUs and H06.
Index A Add File System Directory dialog, 48 Add Source dialog, 30, 47 amap command, 50 application console, 37 Arguments tab of Debug Configurations dialog, 16, 43 ASSIGNs specifying for Guardian applications, 18, 45 using in a command file, 18, 45 B break command, 50 breakpoints for NonStop applications, 35 fractional line numbers, 35 C C and C++ applications, debugging, 6 catch abend command, 50 catch load command, 50 catch stop command, 50 catch unload command, 50 CDT, 6 documentation, 6 COBOL applica
N Native Inspect commands in Console view, 37 console, 37 documentation, 7, 50 EINSCSTM file, 37 supported commands, 50 versions supported, 52 NonStop Application debug configurations debugging options, 31 NonStop applications alternate source file locations, 28 breakpoints for, 35 casting registers to a different type, 36, 39 casting variables, 35 considerations for memory, 36 considerations for register values, 36 considerations for variable values, 35 controlling the execution of, 33 debugging C or C++ a
W watch expressions for NonStop applications, 34 watchpoints for NonStop applications, 34 support for, 34, 40 Workbench documentation, 6 help, accessing, 6 55