
NonStop Development Environment for Eclipse Debugging Supplement
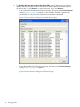
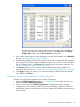
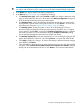
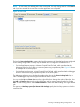

To select a process, click in the row that contains the process, then click OK. The
process CPU and PIN are displayed in the boxes in the Main tab of the Debug
Configurations dialog, and the Process Browser dialog closes.
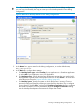
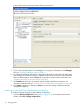
5. If you want to specify options for the debugger to use, type the information in the Debugger
tab. See “Specifying debugger options” (page 31).
6. By default, the debugger searches for source files at the path recorded when the application
was compiled. If you need to specify a different location, such as when you have moved the
files to a different system, use the Source tab to specify the current location of the files. See
“Specifying alternate source file locations” (page 28).
7. The Common tab allows you to set other options related to the Eclipse workspace. For
information about this tab, see “Common tab for NonStop debug configurations” (page 49).
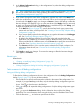
8. Click Apply to apply your changes. To revert to the settings in effect the last time changes
were applied, click Revert.
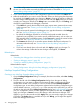
Modifying an existing NonStop Attach Process debug configuration
To modify an existing NonStop Attach Process debug configuration:
1. Open the Debug Configurations dialog (Figure 6 (page 21)). For example, from the main
toolbar, select Run→Debug configurations.
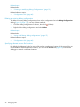
2. The list in the left side of the Debug Configurations dialog shows the types of debug
configurations you can create in addition to the names of debug configurations that have
already been created in this workspace. In this list, double-click the debug configuration you
want to modify.
Creating or Modifying Debug Configurations 23