
NonStop Development Environment for Eclipse Debugging Supplement
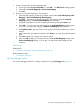
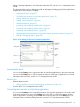
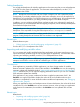
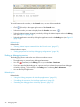
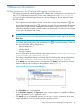
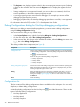

Figure 11 Debugger tab
• The Use default debugger option is selected by default. To use a different debugger than the
default debugger (for example, you have installed a different version of the debugger in
another location), select Use debugger at the following path: and type the path in the box or
click Browse... to locate and select the debugger you want to use.
• (NonStop Application debug configurations only) By default, Stop at main entry point after
launch is selected. To specify a function at which to stop before the main entry point is reached,
select Stop at the following function after launch: and type the name of the function in the box.
• By selecting the options in Automatically track*:, you can choose to automatically track and
update the values of variables in the Variables view and shared library loads in the Modules
view. By default, automatic updates are disabled.
NOTE: Automatic updates of the Variables and Modules views slow stepping performance.
When automatic updates are enabled, the stepping performance is most impacted when you
step your application into a function, because that is when the initial local variable list for the
function is created. To improve stepping performance, see “Improving the stepping performance
of the debugger” (page 9).
Related topics
Related tasks:
• “Creating or Modifying Debug Configurations” (page 13)
Related reference topics:
• “Debugger tab” (page 46)
Using the Debug perspective for NonStop applications
The Debug perspective for NonStop applications, snapshot files, and processes is an extension of
the C/C++ Development Toolkit (CDT), and is nearly identical to the CDT Debug perspective. For
a brief description of the key differences, see “Debug perspective for NonStop debugging
configurations” (page 39). Figure 12 shows an example of the Debug perspective being used to
32 Debugging Tasks