
NonStop Development Environment for Eclipse Debugging Supplement

debug a NonStop application. For information about the CDT, see the C/C++ Development User
Guide.
This topic describes common debugging tasks as they apply to debugging NonStop applications,
snapshot files, and processes, including:
• “Inspecting the stack” (page 33)
• “Controlling the execution of a NonStop application” (page 33)
• “Setting watchpoints” (page 34)
• “Setting watch expressions” (page 34)
• “Setting breakpoints” (page 35)
• “Inspecting and modifying variable values” (page 35)
• “Inspecting and modifying register values” (page 36)
• “Inspecting and modifying memory” (page 36)
• “Debugging NonStop applications using Native Inspect (einspect) commands” (page 37)
• “Ending a debugging session” (page 38)
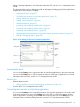
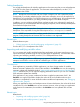
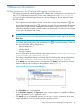
Figure 12 The Debug perspective for NonStop applications
Inspecting the stack
You can use the Debug view to inspect the stack for NonStop applications in the same ways that
you can use the Debug view in CDT to inspect the stack for other kinds of applications. For more
information about this task, see the C/C++ Development User Guide.
Related topics
Related reference topics:
• “Debug perspective for NonStop debugging configurations” (page 39)
See also the C/C++ Development User Guide.
Controlling the execution of a NonStop application
You can use the Debug view to control the execution of a NonStop applications in the same ways
in the same ways that you can use the Debug view in the CDT to control the execution of other
kinds of applications, including using the Run menu and using the icons in the Debug view. For
information about controlling debug execution, see the C/C++ Development User Guide.
Using the Debug perspective for NonStop applications 33