
NonStop NS-Series Operations Guide (H06.12+)
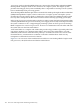
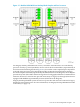
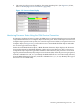
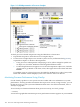
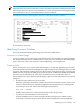

Figure 9-3 OSM Representation of Processor Complex
To check processor-related components using the OSM Service Connection:
1. Expand the tree pane to check all Processor Complex objects.
2. If a Processor Complex object icon contains a yellow arrow (as illustrated in Figure 9-3),
expand that complex to check its subcomponents.
• If any processor subcomponent is displaying a red or yellow triangular symbol over
its object icon, check the Attributes tab for degraded attribute values.
• If a bell-shaped alarm icon appears next to the subcomponent’s object icon, check the
Alarms tab. To get details on an alarm, select, then right-click on the alarm and select
Details.
If a problem exists on a logical processor, the Halt Flag attribute has a value of true, and a
Halt Code attribute value is displayed, refer to the Processor Halt Codes Manual.
Monitoring Processor Performance Using ViewSys
Use the ViewSys product to view system resources online and to see information on system
performance. ViewSys provides information about processor activity. Using ViewSys, you can
list the processors on your system and determine their status. For more information, refer to
ViewSys on page B-6.
To use ViewSys to obtain information about processor activity, at a TACL prompt:
> VIEWSYS
A series of bar graphs that summarize processor performance statistics appears on your terminal.
108 Processors and Components: Monitoring and Recovery