
NonStop NS-Series Operations Guide (H06.12+)


Using the OSM Service Connection
The OSM Service Connection can be used in a variety of ways to monitor your system, including:
• Use of colors and symbols to direct you to the source of any problems
• Attribute values for system resources, displayed in the Attributes tab and in many dialog
boxes.
• Alarms, displayed in the Alarms tab and Alarm Summary dialog box.
The following section presents one model for using the OSM Service Connection to monitor your
system, along with a few other options.
A Top-Down Approach
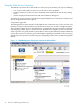
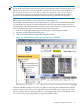
The Management (or main) window of the OSM Service Connection uses a series of colors and
symbols to notify you that problems exist within the system. You can tell at a high-level glance
when problem conditions exist, then drill-down, or expand the tree pane to find the component
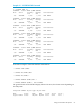
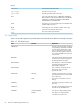
reporting the problem. Figure 3-1 illustrates how both the the rectangular system icon (located
at the top of the view pane) and the system object in the tree pane indicate problems within the
system. The system icon, which is green when OSM is reporting no problems on the system, has
turned yellow. The system icon in the tree pane is displaying a yellow arrow to indicate a problem
within.
Figure 3-1 OSM Management: System Icons Indicate Problems Within
54 Overview of Monitoring and Recovery