
NonStop NS-Series Operations Guide (H06.12+)


NOTE: In the OSM Service Connection Management window, the tree pane is located on the
far left. In the lower right is the Overview pane. Located between them is the details pane, from
which you can choose to view the Attributes or Alarms tab. Directly above the details pane is
the view pane, from which you can choose a Physical or Inventory view of your system or
ServerNet Cluster. The gray bar directly above the view pane is an OSM-specific toolbar (as
opposed to the standard Internet Explorer menu bar at the top of the browser window).
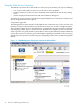
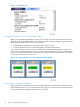
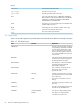
Expanding the system object in the tree pane, you can see a yellow arrow on the Group 110 object,
indicating that the problem is located somewhere within that group.
Expanding the tree pane further, as illustrated in Figure 3-2, yellow arrows on the IOAM Enclosure
110 and IOAM 110.3 objects reveal that the problem exists on a ServerNet adapter in slot 3 of
that I/O module. The red bell-shaped icon by that resource object (in the tree pane) indicates that
there is an alarm on the object. To obtain information about the alarm:
1. Click to select the object displaying the red triangular and bell-shaped symbols.
2. Select the Alarms tab from the details pane.
3. Click to select the alarm, then right-click and select Details.
Figure 3-2 Expanding the Tree Pane to Locate the Source of Problems
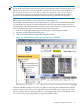
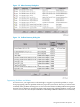
Check the Attributes tab (Figure 3-3) also, as a yellow or red triangular symbol indicates problem
attribute values exist. In this case, the degraded Service State attribute was caused by an alarm.
However, when a resource displays a yellow or red triangular object but no bell-shaped icon, it
has no alarms but is reporting problem or degraded attribute values.
Using OSM to Monitor the System 55