
NonStop Operations Guide for H-Series and J-Series RVUs
CLIM, Processor, Expand File, Process, RDF and other entity information and report it to a
local-node ASAP database server.
• The ASAP Server collects and normalizes network-wide application and system availability
data and stores this information in the ASAP database. The ASAP local-node server includes
command interpreters and database servers which act on behalf of ASAP workstation clients.
• The ASAP Client includes GUI and intelligent agent functions that allow you to view and
analyze system and application statistics. Using ASAP, you can view the overall state of your
NonStop systems and applications, as well as performance information. You can focus on
specific nodes, entities, and objects.
From the ASAP client, you can open and use these windows and view to obtain NonStop system
and application information:
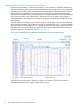
• The Browse window allows you to browse and analyze node-entity-object availability and
performance statistics. You can see both data grid and graph views of the specified area.
The window updates automatically in real time based on the selected nodes, entities, and
objects.
• The OSC window provides a high-level graphical overview of object state changes and a
detailed log of state changes. You can obtain both high-level and detailed state change
information.
• The Graph window shows information in a compact graphical form useful for maintaining
multiple views of nodes, entities, and objects.
• The Report window shows detailed reports about a selected node, entity, or object in a Browse
or Graph window. You open Report windows from a Browse or Graph window by using
context-sensitive pop-up windows.
• The Session window controls your Host session. You can start and stop Host Sessions using
the window’s menus or toolbar, and monitor Host Sessions through the window’s Session log.
The Session log contains information about host communications and software versions.
• The ASAP Properties window allows you to customize which entities and attributes are displayed
from the Browse and Graph windows.
• OIL tree view provides a hierarchical view of host nodes, entities, and objects so that you can
view the overall availability and performance of many nodes, entities, and objects. Availability
and Performance icons are displayed in the OIL tree view to guide you to the nodes, entities,
and objects with the highest alerts.
For more information, see the NonStop ASAP documentation, including the NonStop ASAP Client
Manual, NonStop ASAP Server Manual, and NonStop ASAP Quickstart Guide.
Web ViewPoint
Web ViewPoint is a browser-based interface that monitors the performance and manages the
operations of NonStop subsystems. Information is displayed in a GUI format where alert icons
identify components that require attention. A graphical drill-down interface is also provided. In
most cases, clicking on a NonStop component’s displayed data field exposes other related
information as well as the commands applicable to that component.
Web ViewPoint uses several plug-ins to add functional components to the Web ViewPoint menus,
including:
• ASAP plug-in
• Storage Analyzer plug-in
• Event Analyzer plug-in
For more detailed information about Web ViewPoint, see the Web ViewPoint User Guide.
HP Manageability Tools That Monitor NonStop Performance 73