
NonStop Operations Guide for H-Series and J-Series RVUs
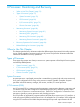
The Central Display Panel on the right uses grids, lists, and details to display the current selection
on the tree. It contains:
• In the top left center, three selection tabs: Utilization, Volumes, and Summary. When the
Volumes or Summary tab is selected, you can choose from a series of Alert icons with checkable
boxes to select to display only disks which have the selected Alerts on them.
• Above the tree, a User Filter to control the scope of content displayed.
• In the upper right corner of the Central Display Panel is Date Navigation, which allows you
to display information for a specified date, and a Trend icon that, when clicked, opens a new
Trend Display window from which you can select and display trend values for various metrics.
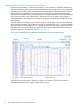
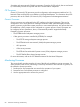
The Disk Utilization tab initially displays a Utilization Summary, which contains three pie chart
diagrams of the system’s total disk usage by percentage of used and free space, physical disks
utilization by groups, and the total number of files used by each group. Below the charts is a table
that summarizes the file and size usage for each group.
The Volumes tab displays information about all the volumes and drives that are present in the
system.
The Physical tab displays information about physical disks.
The Web ViewPoint NonStop Disk Analyzer plug-in provides methods for obtaining additional
performance information about a selected disk and its subvolume on the current node. From the
tree hierarchy, you can drill down to a particular disk and its subvolumes to display Disk Properties
for an expanded view of their attributes and the alerts generated by them. Clicking on a disk from
the tree changes the Central Display. Two tabs, Properties and Sub Volumes, are displayed. The
Properties tab can also be displayed by clicking on the desired disk from the Volumes tab in the
Central Display section.
The Properties tab displays information for SCF Configuration, Storage, Content, Disk Alerts, File
Alerts, and the subvolume trending window. SCF Configuration specifies whether a disk is physical
or not. The Show physical link(s) button lets you launch a window that displays the SCF configuration
of a disk. This window displays the pool to which the to which the disk belongs and the logical
drives that the pool contains.
The Subvolumes tab displays information for Sub Volume, Alerts information, File Count, Total
Size, New Fie Count, and New Size. Sub Volume identifies the name of the subvolume and provides
a clickable link to the Subvolume information for the selected disk.
For more information about the Web ViewPoint NonStop Storage Analyzer plug-in and how to
use it, see the Web ViewPoint WVP NonStop Storage Analyzer Plug-in User Guide.
HP Operations Agent for NonStop (OVNM)
HP Operations Agent for NonStop (OVNM) integrates HP Operations Software (previously known
as HP OpenView) with NonStop systems and provides end-to-end management of your NonStop
environment.
You can use OVNM to:
• Manage NonStop system and application events using the OVNM console.
• Define threshold settings on NonStop objects.
• Define service maps of managed objects for the OVNM Console and HP Operation Manager.
For more information, see the HP Operations Agent for NonStop User and Installation Guide for
Windows and the other OVNM documentation.
HP Performance Agent for NonStop (OVNPM)
HP Performance Agent for NonStop (OVNPM) monitors NonStop system applications and customer
applications, as well as NonStop system hardware and system software components.
HP Manageability Tools That Monitor NonStop Performance 75