
NonStop Operations Guide for H-Series and J-Series RVUs

Automated HP Tools That Monitor Processes
NonStop Availability Statistics and Performance (ASAP), HP Operations Agent for NonStop
(OVNM), and HP Performance Agent for NonStop (OVNPM) can monitor processes and alert you
to exception conditions or other performance problems. See Table 15 (page 81).
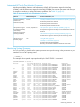
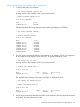
Table 15 Automated HP Tools That Monitor Processes
For more information, see..Monitored objectsHP tools
“NonStop Availability Statistics and Performance (ASAP)” (page 72)ProcessNonStop Availability
Statistics and
Performance (ASAP)
HP NonStop ASAP Server Manual
HP NonStop ASAP Client Manual
HP NonStop ASAP QuickStart Guide
“HP Operations Agent for NonStop (OVNM)” (page 75)Process, Expand LineHP Operations Agent
for NonStop (OVNM)
HP Operations Agent for NonStop User and Installation Guide for
Windows
and NonStop
Performance Agent for
NonStop (OVNPM)
“HP Performance Agent for NonStop (OVNPM)” (page 75)
HP Performance Agent for NonStop Server Monitoring Guide
“Using HP SIM” (page 55)CIPHP SIM using I/O
Essentials plug-in
“NonStop I/O Essentials” (page 57)
HP SIM for NonStop Manageability
NonStop I/O Essentials Installation and Quick Start Guide
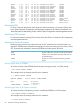
Monitoring System Processes
You can use TACL to check that the system processes are up and running in the processors as you
intended. From a TACL prompt, enter:
> STATUS *
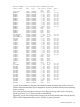
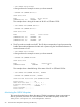
This example shows partial output produced by the TACL STATUS * command:
$SYSTEM STARTUP 2> status *
Process Pri PFR %WT Userid Program file Hometerm
0,0 201 P R 000 255,255 $SYSTEM.SYS14.NMONTOR $YMIOP.#CLCI
0,1 210 P 040 255,255 $SYSTEM.SYS14.NMEMMAN $YMIOP.#CLCI
0,2 210 P 051 255,255 $SYSTEM.SYS14.NMSNGERR $YMIOP.#CLCI
$0 0,3 201 P 011 255,255 $SYSTEM.SYS14.OPCOLL $YMIOP.#CLCI
0,4 211 P 017 255,255 $SYSTEM.SYS14.TMFMON $YMIOP.#CLCI
$YMIOP 0,5 205 P 251 255,255 $SYSTEM.SYS14.TMIOP $YMIOP.#CLCI
$ZNUP 0,6 200 P 015 255,255 $SYSTEM.SYS14.NZNUP $YMIOP.#CLCI
$Z0 0,7 200 P 015 255,255 $SYSTEM.SYS14.OCDIST $YMIOP.#CLCI
$ZOPR 0,8 201 P 011 255,255 $SYSTEM.SYS14.OAUX $YMIOP.#CLCI
$ZCNF 0,9 200 P 001 255,255 $SYSTEM.SYS14.TZCNF $YMIOP.#CLCI
$ZTM00 0,11 200 P 017 255,255 $SYSTEM.SYS14.TMFMON2 $YMIOP.#CLCI
$TMP 0,12 204 P 005 255,255 $SYSTEM.SYS14.TMFTMP $YMIOP.#CLCI
$ZL00 0,13 200 P 001 255,255 $SYSTEM.SYS14.ROUT $ZHOME
$NCP 0,14 199 P 011 255,255 $SYSTEM.SYS14.NCPOBJ $ZHOME
$ZEXP 0,15 150 P 001 255,255 $SYSTEM.SYS14.OZEXP $ZHOME
$CLCI 0,34 199 000 0,0 $SYSTEM.SYS14.TACL $YMIOP.#CLCI
$TRAK 0,40 146 000 255,255 $SYSTEM.SYSTOOLS.QATRACK $ZHOME
$Z00Y 0,43 150 015 255,255 $SYSTEM.SYS14.FDIST $ZHOME
$NULL B 0,45 147 001 255,255 $SYSTEM.SYSTEM.NULL $Z01J
$ZNET 0,64 175 P 011 255,255 $SYSTEM.SYS14.SCP $ZHOME
$Z1RL 0,249 148 R 000 98,98 $SYSTEM.SYS14.TACL $ZTNT.#PTBY5D
$SYSTEM 0,257 220 P 317 255,255 $SYSTEM.SYS14.TSYSDP2 $YMIOP.#CLCI
$ZHOME 0,292 199 P 001 255,255 $SYSTEM.SYS14.ZHOME $YMIOP.#CLCI
$ZM00 0,294 201 P 015 255,255 $SYSTEM.SYS14.QIOMON $ZHOME
$ZZWAN 0,295 180 011 255,255 $SYSTEM.SYS14.WANMGR $ZHOME
$ZZSTO 0,296 180 P 011 255,255 $SYSTEM.SYS14.TZSTO $ZHOME
$ZZLAN 0,297 199 P 015 255,255 $SYSTEM.SYS14.LANMAN $ZHOME
Monitoring Processes 81