
NonStop Server for Java 5.0 Programmer's Reference


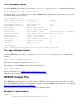


The -Xrunhprof Option
To run the HPROF Java profiler, you can use the -Xrunhprof option on the java command. The format is:
java -Xrunhprof:[help]|[option=value, ...]
Use the following java command to get a listing of HPROF help, which displays option-value pairs you can
use with NonStop Server for Java 5.
java -Xrunhprof:help
Option Name and Value Description Default
--------------------- ----------- -------
heap=dump|sites|all heap profiling all
cpu=samples|times|old CPU usage off
monitor=y|n monitor contention n
format=a|b ascii or binary output a
file=<file> write data to file java.hprof(.txt for ASCII)
net=<host>:<port> send data over a socket write to file
depth=<size> stack trace depth 4
cutoff=<value> output cutoff point 0.0001
lineno=y|n line number in traces? y
thread=y|n thread in traces? n
doe=y|n dump on exit? y
For example,
java -Xrunhprof:cpu=samples,file=log.txt,depth=3 FooClass
The -agent:libname Option
To run the HPROF Java profiler, you can use the -agent:libname option on the java command. The
format is:
java -agent:libname=[options]
This option loads the native agent library libname.
For example, to run the HPROF Java profiler, the command is:
java -agent:hprof
For more information, see JVMTI Agent Command Line Options
(http://java.sun.com/j2se/1.5.0/docs/guide/jvmti/jvmti.html#starting).
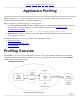
HPROF Output File
Three HPROF examples appear below: CPU samples, CPU times, and a heap for the sites profile. For details
about using HPROF output and interpreting these examples, search for HPROF on the Web. Also, see the paper
Diagnose common runtime problems with hprof
(http://www.javaworld.com/javaworld/jw-12-2001/jw-1207-hprof.html).
Example 1: cpu=samples
TRACE 62:
WorkClass.doSomeWork(WorkClass.java:12)