
NonStop Server for Java 5.0 Programmer's Reference

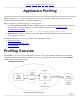


Profiling Techniques
When you run HPROF, consider these techniques for using options:
Do not use multiple profiling options together because each option affects performance. Using a single
option provides data closer to typical performance than multiple options.
●
Try profiling both CPU samples and CPU times; the results from each may differ.
cpu=samples
cpu=times
●
Try varying the trace resolution:
Change trace depth:
depth=levels
❍
Remove line numbers:
lineno=n
❍
Add threads:
thread=y
❍
●
To determine whether the program uses a complex multithreaded scheme, use the monitor option
monitor=y
An empty result list is good.
●
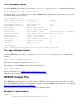
Using HPjmeter
You can use the HPjmeter for profiling your application.
On the NonStop server platform, HPjmeter allows you to view profiler data graphically. You can obtain
HPjmeter without charge from HP.
To use HPjmeter, the dump file must be an ASCII text file and must be produced by NonStop Server for Java 5
after a normal termination or exception termination. If your application terminates with a signal, NonStop
Server for Java 5 will not generate the dump file.
For more information about HPjmeter including links for an HPjmeter tour and downloading, see HPjmeter
Overview and Features (http://www.hpjmeter.com).
For more information about java, see the NonStop Server for Java Tools Reference Pages.
Title Page | Contents | Index | Glossary | Prev | Next
NonStop Server for Java 5.0 Programmer's Reference (540385-001)
© 2003 Hewlett-Packard Development Company L.P. All rights reserved.