
NonStop Server for Java 5.1 Programmer's Reference

y means listen for a debugger application
address=transport-address-for-this-connection
The transport address is the port number in which the debuggee is listening on for the debugger.
suspend=y
Suspends the debuggee just before the main class loads.
Optionally, you can specify the -Xinit argument to specify using only the interpreter and not the HotSpot
compiler.
Starting the Java Debugger (jdb) Tool
Now, the Java Debugger (jdb) tool can be started to communicate with the debuggee by using the jdb command
as described for various situations.
If you are using JDB on the same NonStop system where the debuggee runs, use
jdb -attach portnum
●
If you are using JDB on a different NonStop system from where the debuggee runs, use
jdb -attach host-name:portnum
●
If you are using JDB from Microsoft Windows or any other platform, use
jdb -connect com.sun.jdi.SocketAttach:hostname=hostname,port=portnum
●
Further Information
If you are using a GUI debugger, refer to the vendors' documentation to configure the debugger to communicate
with the debuggee.
Remote debugging of NonStop Server for Java 5.1 applications has been tested with Eclipse 3.1 of the Eclipse
Project. For information and software downloads, see the website at http://www.eclipse.org/.
For more details on command-line options, see Connection and Invocation Details
(http://java.sun.com/j2se/1.5.0/docs/guide/jpda/conninv.html).
Debugging JNI Code
To debug native code that the application writers wrote and linked with the Java program, use the inspect debugger
tool available on the NonStop system. Use Visual Inspect (the preferred debugger) or Native Inspect; for further
information, see the Native Inspect Manual.
You can use the following command to start java under an inspect debugger:
run -debug java java_options
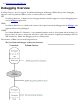
To debug native code, load the DLL first. Visual Inspect lets you stop the program after the DLL is loaded so you
can set breakpoints.
You can see and debug only the native routine to be debugged and other native routines that that routine calls. All
other scopes above the native routine are compiled or interpreted Java code, which the inspect debugger has no