
NonStop Server for Java 5.1 Programmer's Reference

knowledge about.
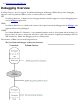
Using Visual Inspect To Add an Event Breakpoint on DLL Open Event
Because Visual Inspect does not support deferred breakpoints, you need ensure that a DLL is loaded before setting
a breakpoint. Visual Inspect supports the DLL Open event breakpoint that suspends the program just after a DLL is
loaded but before initialization routines are invoked.
To add an Event Breakpoint on DLL Open event:
In Visual Inspect, choose View > Breakpoints in Application or Program Control view.1.
Click the Event tab.2.
Click Add Breakpoint and select DLL Open from Event Name drop-down menu.3.
Click OK.4.
Debugging Java and JNI Code
You can use the Native Inspect debugger tool to debug the native code and the Java Debugger tool to debug the
Java code at the same time. You need to start the Java debuggee process under a debugger. For example, type the
following command.
run -debug java -Xdebug -Xnoagent -Xrunjdwp:sub-options
Then, you can use the Java Debugger tool to communicate with the debuggee process as explained under
Debugging Overview.
Deviations in JVM Specification Options
The compiler specification options for both the java and jdb tools deviate from standard Java because
NonStop Server for Java 5.1 implements only the HotSpot server VM and does not implement a client VM.
Accordingly, the options that specify running the client VM are not valid.
java: Java Application Launcher Command-Line Option
Deviations
-client
Selects the Java HotSpot Client virtual machine (VM).
Note: The -client option is not valid with NonStop Server for Java 5.1.
-server
Selects the Java HotSpot Server virtual machine (VM).
Note: -server the default option for NonStop Server for Java 5.1; therefore, specifying
-server is optional.
For more information about the java tool and additional deviations from standard Java, see Implementation of