
NonStop Server for Java 5.1 Programmer's Reference

Title Page | Contents | Index | Glossary | Prev | Next
Application Profiling
With a profiling tool, you can get information about your Java program's CPU usage, heap allocation, and
threads. Using this information, you can tune an application.
The tools supported by NonStop Server for Java 5.1 include:
Java Virtual Machine Profiler Interface (JVMPI) provides a profiler interface that tool vendors can use to
develop GUI tools for profiling Java programs. JVMPI is described in the Sun Microsystems
documentation for JVMPI
(http://java.sun.com/j2se/1.5.0/docs/guide/jvmpi/index.html).
●
-Xeprof, an HP proprietary option for profiling Java applications. The output of this tool is in a format
which can be used to view and analyze the detailed statistics in an offline mode with HPjmeter.
●
HPROF Profiler Agent is a simple profiler agent shipped with the J2SE and, therefore included with
NonStop Server for Java 5.1.
●
Profiling NonStop Server for Java 5.1 programs is described in these topics:
Profiling Overview●
Using HPjmeter●
Using -Xeprof Java Profiler●
Using the HPROF Profile Agent●
Profiling Overview
Xeprof
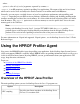
The -Xeprof option generates profile data for HPjmeter. The -Xeprof option controls profiling of Java
applications running on JRE for HP NonStop operating system for the Java™ 2 Platform and collects method
clock and CPU times, method call count, and call graph, which can be viewed and analyzed using HPjmeter .
(For more information on HPjmeter, see www.hp.com/go/hpjmeter.)
Note: Zero preparation profiling is started from the command line by sending a signal to the JVM
to start eprof. Engaging zero preparation profiling may have a short term impact on application
performance as the JVM adjusts to the demands of performing dynamic measurements.
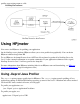
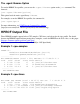
HPROF
The JVMPI is a two-way, function-call interface between a Java virtual machine and an in-process profiler
agent. The profiling environment for NonStop Server for Java 5.1 programs is illustrated showing the HPROF