
NonStop Server for Java 5.1 Programmer's Reference

where:
options is a list of key[=value] arguments separated by commas. >
–Xeprof is an HP proprietary option for profiling Java applications. The output of this tool is in a format
which can be used to view and analyze the detailed statistics in an offline mode with HPjmeter.
Generally, you can expect a twofold decrease of your Java application performance when profiling with
-Xeprof. Depending on your JRE version or platform, dynamically enabling and disabling profiling might
introduce much higher overhead for several minutes. It is advised that the data collection period is no shorter
than 30 minutes. The -Xeprof option needs to allocate memory to store the profile data. It uses the same
memory pool as the JVM does.
Note:
Starting with NonStop Server for Java 5.1 version T27766H51^ABO, the eprof profiler
performs better on the Integrity NonStop BladeSystem platform than the Integrity NonStop Server
platform. This results in lower profiling overhead in terms of the processor utilization.
For more information on -Xeprof and supported -Xeprof options , see the NonStop Server for Java 5.1 Tools
Reference Pages.
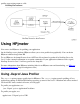
Using the HPROF Profiler Agent
You can use the HPROF Profiler Agent for profiling your application. In the NonStop Open System Services
(OSS) environment, HPROF is statically linked. HPROF writes out profiling information either to a file or to a
socket in ASCII or binary format. By using HPROF, you can get information about your application's CPU
usage, heap allocation, and threads.
Topics are:
Overview of the HPROF Java Profiler●
Running the HPROF●
HPROF Output File Options●
Tips●
Profiling Techniques●
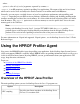
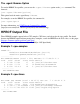
Overview of the HPROF Java Profiler
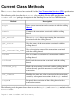
The main profiling options you use for NonStop Server for Java 5.1 programs are:
Option Description
CPU sampling
Specifies time-linear snapshots of the NonStop Server
for Java 5.1 execution stack.