
NonStop Server for Java 5.1 Programmer's Reference
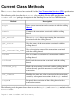
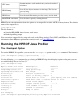

CPU times
Instrumentation: track-method entry and track-method
exit times.
HEAP dump
Lists all live object instances in the heap. The list can
get very long.
HEAP sites Lists the total allocations per class, array, and so forth.
MONITOR contention Lists the times spent by waiting threads.
HPROF writes the information about the options to an output file in either ASCII or binary format. The default
name of the output file is:
java.hprof.txt
The file format is:
Standard HEADER, thread events, stack traces
●
Ranked profiling output●
You can analyze output files by using such tools as the Heap Analysis Tool (HAT) and HPjmeter. For more
information about HPjmeter performance-analysis tool, see Using HPjmeter.
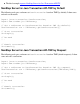
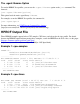
Running the HPROF Java Profiler
The -Xrunhprof Option
To run the HPROF Java profiler, you can use the -Xrunhprof option on the java command. The format is:
java -Xrunhprof:[help]|[option=value, ...]
Use the following java command to get a listing of HPROF help, which displays option-value pairs you can
use with NonStop Server for Java 5.1.
java -Xrunhprof:help
Option Name and Value Description Default
--------------------- ----------- -------
heap=dump|sites|all heap profiling all
cpu=samples|times|old CPU usage off
monitor=y|n monitor contention n
format=a|b ascii or binary output a
file=<file> write data to file java.hprof(.txt for ASCII)
net=<host>:<port> send data over a socket write to file
depth=<size> stack trace depth 4
cutoff=<value> output cutoff point 0.0001
lineno=y|n line number in traces? y
thread=y|n thread in traces? n
doe=y|n dump on exit? y
For example,
java -Xrunhprof:cpu=samples,file=log.txt,depth=3 FooClass