
NonStop Server for Java 5.1 Programmer's Reference


Tips
In the java command, specify no compiler:
-Djava.compiler=NONE
●
In Java native code (JNI), the CPU options also time native code where line-number information is not
available.
●
CPU time is not measured when process is blocked, for example, on a call to SQL.●
To dump profiling information before the program exits:
Be sure to specify the -Xrunhprof option.
❍
You can send a SIGQUIT signal to the JVM by typing
$ kill -QUIT java-process-id
You might need to specify the dump exit option as DOE=n to avoid an automatically generated
dump.
❍
Alternatively, type a control key plus a backslash (Ctrl+\), which generates a SIGQUIT signal in
the OSS environment.
❍
●
Avoid using the default profiling option, heap=all, which produces both the dump profile and sites
profile, because this option skews the sites profile.
●
Profiling Techniques
When you run HPROF, consider these techniques for using options:
Do not use multiple profiling options together because each option affects performance. Using a single
option provides data closer to typical performance than multiple options.
●
Try profiling both CPU samples and CPU times; the results from each may differ.
cpu=samples
cpu=times
●
Try varying the trace resolution:
Change trace depth:
depth=levels
❍
Remove line numbers:
lineno=n
❍
Add threads:
thread=y
❍
●
To determine whether the program uses a complex multithreaded scheme, use the monitor option
monitor=y
An empty result list is good.
●
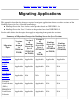
Limitations of Using HPjmeter on HP NonStop operating
system