
NonStop Server for Java 6.0 Tools Reference Pages
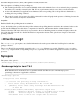
At every garbage collection, the following 20 fields are printed:
<GC: %1 %2 %3 %4 %5 %6 %7 %8 %9 %10 %11 %12 %13 %14 %15 %16 %17 %18 %19 %20>
%1 Indicates the type of the garbage collection.
1: represents a Scavenge (GC of New Generation only)
%2: indicates if this is a parallel scavenge.
0: non-parallel scavenge
n(>0): parallel scavenge, n represents the number of parallel GC
threads
2: represents an Old Generation GC or a Full GC
%2: indicates the GC reason:
1: Allocation failure, followed by a failed scavenge, leading to a
Full GC
2: Call to System.gc
3: Tenured Generation full
4: Permanent Generation full
5: Scavenge followed by a Train collection
6: Concurrent-Mark-Sweep (CMS)eneration full
7: Old generation expanded on last scavenge
8: Old generation too full to scavenge
9: FullGCAlot
10: Allocation profiler triggered
11: JVMTI force GC
12: Adaptive Size Policy
13: Last ditch collection
3: represents a complete background CMS GC
%2: indicates the GC reason:
1: Occupancy > initiatingOccupancy
2: Expanded recently
3: Incremental collection will fail
4: Linear allocation will fail
5: Anticipated promotion
4: represents an incomplete background CMS GC
%2: n.m
n indicates the GC reason:
1: Occupancy > initiatingOccupancy
2: Expanded recently
3: Incremental collection will fail
4: Linear allocation will fail
5: Anticipated promotion
6: Incremental CMS
m indicates the background CMS state when yielding:
0: Resetting
1: Idling
2: InitialMarking
3: Marking
4: FinalMarking
5: Precleaning
6: Sweeping
7: AbortablePreclean
(exited after yielding to foreground GC)