
NonStop Server for Java 7.0 Programmer's Reference

The GC data is written to a file named java_pid.vgc in the current directory of the
JVM process.
Allow the profiling to continue for a desired length of time.
iv. Stop the data collection interval by sending the same signal to the JVM:
kill -ALRM pid
v. You can now open the saved file in the HPjmeter console and view the collected metrics.
After completing the data file collection, perform the following steps:
1. Transfer the data file to an HPjmeter console compatible platform (HP-UX, Windows, or Linux).
2. Run the HPjmeter console and open the data file.
NOTE:
• NSJ7 supports rotational GC logging in multiple GC log files to help control the GC log file
size. For information on GC log rotation, see “GC log rotation” (page 59).
• For information on analyzing GC profile data, see HPjmeter 4.3 User’s Guide available at
www.hp.com/go/hpjmeter.
• The instructions for using the HPjmeter tool on the NonStop systems are provided in
“Addendum to HPjmeter 4.3 user's guide” (page 101).
Other profiling options
TACL command status can be used to obtain the detailed status of application, including the
process time of a Java process. Also, PSTATE tool can be used to get details about the Java process.
In NSJ7, if Parallel or CMS GC is enabled, a Java application consists of a Java process group
that includes the Java process and GC processes. If parallel or CMS GC is enabled, run the TACL
command status and PSTATE tool individually for the Java and the GC processes. To obtain all the
GC processes for a Java process, nsjps can be invoked with —gc option. For information about
nsjps, see NonStop Server for Java 7.0 Tools Reference.
Also, the C heap usage reported by PSTATE tool for an application running with NSJ7 will be
lesser than C heap usage reported when the same application is run with NSJ6. This is because
most of the JVM allocations and the Java heap are moved to flat segments in NSJ7.
Tuning application performance
This section contains the following topics for tuning application performance:
• “Determining the heap size setting” (page 89)
Determining the heap size setting
You must set the Java heap to a value appropriate for your application for optimal performance.
This section discusses the guidelines for setting the heap size.
To study the frequency and length of the JVM garbage collection operation, use the -verbose:gc
(-Xverbosegc) option in the JVM arguments. Then use this data to tune the heap usage of the
JVM based on your application requirements.
NOTE: JVM allocates the maximum Java heap at start-up. Hence, the swap space considerations
for the JVM process are the maximum Java heap space specified in addition to other JVM memory
requirements and the memory requirements for all native components.
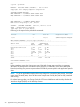
To identify the swap usage of a process or the swap requirements for a CPU, use the NSKCOM
utility.
For example, to identify the swap usage of all the processes or a particular process, enter the
following commands at the OSS prompt:
Tuning application performance 89