
NonStop SPAM User Guide


NonStop SPAM – Version 1.2 – T0814
Page 31 of 44
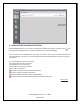
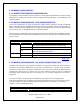
There are two icons next to each entry. The (delete) button is used to delete the processed measure
collections. The (reload) button is to attempt a reload of the file in case of a failure earlier or to reload
data deleted from the database.
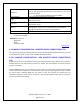
Detailed Log: Clicking on the detail icon for an individual entry, opens a new window, which provides
the details of the transactions such as the Measure location, Interval, Entities, UWS file name, time
taken to complete each step (compressing, downloading, loading etc.).
Back to TOC
4.4 ANALYZE LOADED DATA
4.4.1 INTRODUCTION (ANALYZE LOADED DATA)
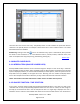
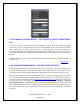
NonStop SPAM installed modules can be accessed through the ‘Analyze’ screen. At the top, a “Calendar
Grid” highlights the days for which data is available shown as dark gray Dates. Only data for the selected
system is displayed; however, to view the data availability for other systems, select the system from the
drop-down menu (i.e \NODE) on the upper left corner. Hovering over this number will display details
such as the multiple measurement collections per day, entities collected and interval of collection.
NOTE: The number on the Date indicates the number of hours for which data is present.
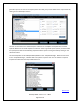
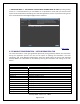
4.4.2 ANALYZE FUNCTION – TIME SELECTION
In the “Cover” panel the selection fields get populated automatically when a user clicks on a date on the
“Calendar Grid” as they are dynamically populated. When the user clicks on a date, the time range for
that day (or the earliest time slot in case of multiple time slots in a single day) is displayed. The user is
allowed to select a subset of the available time based on the time window that the user would like to