
NonStop SPAM User Guide


NonStop SPAM – Version 1.2 – T0814
Page 32 of 44
analyze. Once the time range is selected, the user needs to check a Module box, click on the “Analyze”
button, and view the reports generated by the NonStop module.
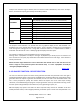
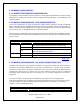
Data for System
Panel
Field
Description
Entity
All: Displays the dates for the available data.
Only: Displays dates that have data for the selected entity.
CALENDAR
Select Database
Displays multiple databases available.
DB Information
Provides the Database’s detail information.
Year
Displays the years for which the data is available for the system.
From Date
Starting Date of analysis.
From Hours
Starting Hour of analysis.
COVER
From Minutes
Starting Minutes of analysis.
Thru Date
Ending Date of analysis.
Thru Hours
Ending Hour of analysis.
Thru Minutes
Ending Minutes of analysis.
ANALYZE
USING
NSR
NonStop SPAM Reporter application
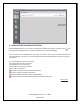
The purpose of the Calendar is to provide the users a graphical display for the data available. The
dropdown lists are for specific date and time queries. ‘From’ is always a starting point in chronological
order through the ending point. For a range with continuous dates it is a representation of what is
selectable. The Calendar for ‘Thru’ is always a graphical display of the final point.
For example a collection can be scheduled for three consecutive days:
Starting “From” 11/15/2013 at 12:00 pm “Through” 11/18/2013 up to 12:00 pm, for an interval of 12
hours and the user can query any subset within the loaded measurement’s time range. Times all have a
military time format.
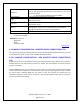
NOTE: The date range selected has to be at least twice the interval time. In this case the user can
select a range for every 24 hours (twice the interval time). i.e. ‘From’ 11/15/2013 at 12:00 pm
‘Through’ 11/16/2013 12:00 pm.
Back to TOC
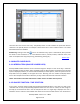
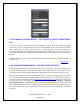
4.4.3 ANALYZE FUNCTION – REPORT SELECTION
The user can select the reports and charts to be generated thru NSR. The parameter list to the right is
initialized with default values. These will be modifiable if the parameter affects the report/chart/ being
generated. Once the reports to generate are selected, the user can click on the ‘Generate’ button. The
user is then prompted to specify the location where the reports are to be saved. Upon clicking
‘Generate’, a window detailing the progress of report generation comes up that shows how long it took
for each report to be generated, if there were any errors generating a report, etc.
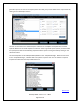
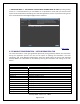
NSR will display only reports and charts for which required entity records are available. It will also
enable parameter values, to be changed (if desired), if selected report or charts uses the parameter in its