
OSI/TS Configuration and Management Manual

Performing Monitoring and Troubleshooting Guide
OSI/TS Configuration and Management Manual—424831-001
4-12
TSP Process Problems
Major Subsystem Components
When discussing top-down troubleshooting strategies, it is helpful to break down the
OSI/TS subsystem into three major components:
•
The user's application
•
The TSP process (including IP in the Network Layer, if you are using TLAM/PAM)
•
The NSP process (TLAM/PAM or X25AM)
In the following subsections, problem-solving information for each of these three major
components is broken down into the following categories:
•
Using SCF commands to analyze symptoms
•
Using PTrace to scan and analyze traces
•
A working example
TSP Process Problems
The TSP process provides reliable end-to-end data transfer. It acts as the provider of
transport services to the user application and is itself the user of the Network Layer
(NSP in either X25AM or TLAM/PAM). The TSP process has its own trace capability.
Error codes, such as error 140, are returned when the TSP subdevice detects an error.
Common problems to look for are ER-TPDUs (error TPDUs) or RJ-TPDUs (reject
TPDUs), and DR-TPDUs (disconnect-request TPDUs) rejecting CR-TPDUs.
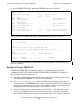
SCF Commands
You can get an overall look at the transport service activity within a TSP process by
using the following command:
STATS SERVICE $TSP.#L4
The returned screen displays a count of the number of TPDUs sent and received, the
number of bytes of user data transferred, and the number of connect requests refused for
any reason. It also shows the number of transfer timeouts, if any, and any TPDU errors
detected.
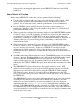
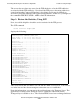
The following command applies only to TSPs configured to use TLAM/PAM:
STATS SERVICE $TSP1.#L3
The returned screen displays the number of IPPDUs exchanged, the number of IPPDUs
discarded, and the reasons they were discarded.
Using the following command, you can get the service information for both #L3 and
#L4: