
OSI/TS Configuration and Management Manual


Performing Monitoring and Troubleshooting Guide
OSI/TS Configuration and Management Manual—424831-001
4-18
Troubleshooting Example
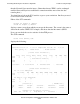
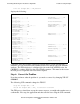
This screen shows that data packets are being exchanged. This information definitely
points to the Transport Layer as the source of the connection problem.
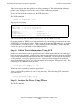
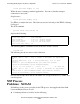
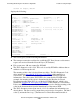
Now you can check the statistics for the TSP subdevice.
The SCF command
stats su $tsp2.#z000022
displays the following:
This screen shows that one TPDU was received and one TPDU was sent.
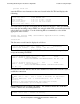
Now that you know TPDUs were sent and received, you should go back and look at the
STATUS SU screen shown earlier. That screen shows that the TSP subdevice is enabled
for attachment (“tcon in progress”), and is waiting for the CR-TPDU. Notice that this
screen also gives you the name of the NSP subdevice.
Step 4: Collect Trace Information, Using SCF
In this case, there have been no operational errors, which means that the error messages
have not been very helpful. At this point, you can only make guesses about the problem
based on the information returned from the SCF commands. To find out the real nature
of the problem, you need to generate a trace. Since you have narrowed the problem
down to the Transport Layer, you can concentrate on tracing the TSP process only. The
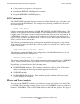
following SCF command starts the trace:
trace process $tsp2, to tr1
While the trace is running, rerun the application.
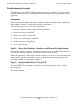
After recording the problem, be sure to stop the trace. The following SCF command
stops the trace:
trace process $tsp2, stop
Step 5: Analyze the Trace, Using PTrace
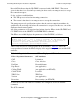
The SCF command
OSITS Stats SU $TSP2.#Z000022
Reset Time.. 10 Oct 1991, 19:31:21.795
Sample Time. 10 Oct 1991, 19:34:44.003
TPDUsSent......... 1 TPDUsRecv........ 1
TPDUsResent....... 0
UserBytesSent..... 0 UserBytesRecv..... 0
ExpeditedBytesSent 0 ExpeditedBytesRecv 0