
SQL/MX 2.x Reference Manual (H06.04+)

MXCI Commands
HP NonStop SQL/MX Reference Manual—540440-003
4-22
DISPLAY STATISTICS Command
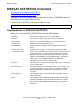
DISPLAY STATISTICS Command
Considerations for DISPLAY STATISTICS
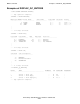
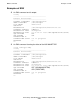
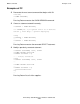
Examples of DISPLAY STATISTICS
DISPLAY STATISTICS displays statistics about the last DML or PREPARE statement
executed within the current MXCI session.
Use DISPLAY STATISTICS only within an MXCI session.
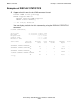
Considerations for DISPLAY STATISTICS
When you issue the DISPLAY STATISTICS command, MXCI displays:
DISPLAY STATISTICS
Start time Time when the query is first issued from MXCI.
End time Time when the query ends and results are displayed.
Elapsed time Equals the sum of the compile time and execution time.
Compile time Amount of time to prepare the query.
Execution time Amount of time used by the SQL executor to execute the
query.
Number of records
accessed and used
Records accessed gives a count of the number of records
accessed in each table. This count includes records examined
by the disk process, the file system, and the SQL executor.
Records used gives a count of records actually used by the
statement. For INSERT and FETCH operations, the count is
always 0 or 1. For UPDATE, DELETE, and SELECT
operations, the count can be greater than 1.
Disk I/Os Disk I/Os gives a count of the number of disk reads caused by
accessing this table.
Message count Message count gives a count of the number of messages sent
to execute operations on this table. For example, a FETCH
operation through a secondary index generally sends two
messages.
Message bytes Message bytes gives a count of the message bytes sent to
access this table.
Lock Lock displays flags indicating that lock waits occurred (W) or
that lock escalations occurred (E) for the table. If this field is
blank, no locks were obtained during the processing of this
statement.