
SQL/MX 2.x Reference Manual (H06.04+)

Metadata Tables
HP NonStop SQL/MX Reference Manual—540440-003
10-6
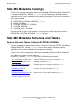
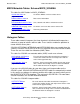
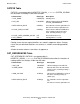
MXCS Metadata Tables: Schema MXCS_SCHEMA
MXCS Metadata Tables: Schema MXCS_SCHEMA
This table lists MXCS tables in MXCS_SCHEMA*:
Histogram Tables
These tables contain histograms that show how data is distributed with respect to a
column or a group of columns within a table. These statistics enable the optimizer to
create efficient access plans.
SQL/MX HISTOGRAM_INTERVALS and HISTOGRAMS tables are created when the
schema is created. The UPDATE STATISTICS statement inserts data into these tables.
These files are also called User Metadata (UMD) Tables.
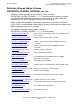
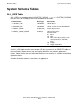
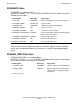
This table lists SQL/MX user metadata tables (UMD) in each user schema:
If you are using SQL/MP tables for your data, there are histogram tables on the
SQL/MP system. SQL/MP HISTOGRM and HISTINTS tables are automatically created
in the same user catalog as the primary partition of the table you specify when you run
the UPDATE STATISTICS statement. They are kept in SQL/MP files. For more about
SQL/MP metadata, see SQL/MP Reference Manual.
This table lists SQL/MP histogram tables:
ASSOC2DS Table on
page 10-79
Associates MXCS service to a data source
DATASOURCES Table
on
page 10-80
Data source information
ENVIRONMENTVALUES Table
on page 10-81
Sets, controls and defines environment values
NAME2ID Table
on page 10-81 Associates service or data source name to ID
RESOURCEPOLICIES Table
on page 10-82
Governing information
*In addition, UMD tables exist here.
HISTOGRAM_INTERVALS
Table on page 10-73
For each interval of the table for which the histogram is
created, the number of rows and unique rows and the
value of the upper boundary
HISTOGRAMS Table
on
page 10-72
Columns, interval count, total number of rows and unique
rows, and the low and high values of column distribution
for the table for which the histogram is created
HISTINTS Table on
page 10-75
For each interval of the table for which the histogram is
created, the number of rows and unique rows and the value
of the interval upper boundary
HISTOGRM Table on
page 10-74
Columns, interval count, total number of rows and unique
rows, and the low and high values of column distribution for
the table for which the histogram is created