
TS/MP 2.5 System Management Manual
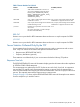


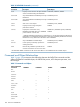

Example 23 RESPONSE TIME INFO Section of Sample Server Statistics
SERVER SERVME?
15:22:3019 FEB 1996,IN TCP TCP1
*
.
.
.
RESPONSE TIME INFO (TIME VALUES IN SECS)
*
:
SEND TO SERVERCLASS
STAND DEVMIN RESPMAX RESP AVG RESPMEAS SUMMARY #
0.490.102.510.5033303
.
.
.
*
Collected only if you have the Pathway/iTS product and TCP STATS ON
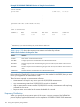
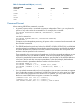
Table 8 (page 122) shows the response time statistics and what they indicate.
Table 8 Server Statistics for Response Time
IndicatesStatistic
Total number of collected measurements# MEAS
Average response time calculated from the collected measurementsAVG RESP
Maximum response time recorded during the given time interval (since statistics were turned on
or reset)
MAX RESP
Minimum response time recorded during the given time interval (since statistics were turned on or
reset)
MIN RESP
Standard deviation calculated from the collected measurementsSTAND DEV
If the number for STAND DEV is large in comparison to the number for AVG RESP, then you must
review your application to determine the cause.
These limits are imposed on measurement collection:
• Measurements will stop for any server upon the 99,999,999th measurement.
• Any measurement greater than 99,999,999.99 seconds is discarded.
• After a measurement counter reaches 99,999,999.99 seconds, measurements will stop being
collected for this server.
• Response times are rounded to the nearest hundredth of a second.
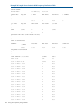
Frequency Distribution
When you specify the FREQTABLE option of the STATS SERVER command, the PATHMON
process displays supplemental statistics on the completion of SCREEN COBOL SEND statements
122 Tuning Your System by Using Statistics