
TS/MP 2.5 System Management Manual
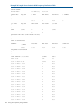

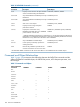

49.900.90 <= TI18 < 0.96
98.816472 0.96 <= TI19 < 1.02
100.03981.02 <= TI20
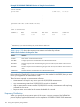
*
Collected only if you have the Pathway/iTS product and TCP STATS ON
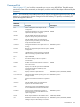
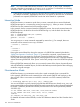
Table 9 (page 125) shows the server statistics for frequency distribution and what they indicate.
Table 9 Server Statistics for Frequency Distribution
IndicatesStatistic
Value of the time increment from one interval to the nextTIME INTERVAL
Total number of measurements collected during the given time interval# MEAS
Cumulative percentage of the total number of measurements the line item representsCUM %
You can use the statistics for frequency distribution to determine the times of peak load for your
system. The example in Example 24 (page 124) shows a bimodal distribution with one peak almost
20 times as long as the other. This is an indication that some system level tuning might be required.
The frequency distribution table is not generated if either of these are true:
• There are fewer than 50 sample measurements collected at the time of the STATS request. In
this case, this text is displayed at the bottom of the STATS SERVER display:
FREQUENCY DISTRIBUTION:? NOT PRODUCED: LESS THAN 50 SAMPLE
MEASUREMENTS TAKEN
• At the fiftieth measurement, the time increment calculated is less than 0.01 second. In this
case, this is displayed at the bottom of the STATS SERVER display:
FREQUENCY DISTRIBUTION:? NOT PRODUCED: COMPUTED INTERVAL
LESS THAN .01 SECS
Server Statistics Collected Only By the TCP 125