
TS/MP System Management Manual (H06.05+, J06.03+)


Tuning Your System by Using Statistics
HP NonStop TS/MP System Management Manual—541819-007
7-3
Queue Info
Table 7-1 shows the statistics for the server-class wait queue and what they indicate. If
these statistics show that requests are queueing, you might want to consider taking
steps to reduce queueing and improve response time. Such steps could include
reconfiguring your system or modifying the application.
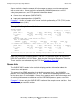
Example 7-2. QUEUE INFO Section of Sample Server Statistics
SERVER SERVME
IN TCP TCP1* 19 FEB 1996, 15:22:30
QUEUE INFO*: REQ CNT % WAIT MAX WAITS AVG WAITS % DYNAMIC
33272 99.8 7 2.37 99.9
.
.
.
IN LINKMON LM1 INTERVAL 10 MINS COUNT 1/5 25 SEP 1984, 11:50:25
QUEUE INFO: REQ CNT % WAIT MAX WAITS AVG WAITS % DYNAMIC
19 0.0 0 0.00 94.7
*Collected only if you have the Pathway/iTS product and TCP STATS ON
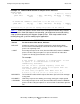
Table 7-1. Server Statistics for QUEUE INFO
Statistic For Server-Class Wait Queue, Indicates:
REQ CNT Number of requests for a link that could not be satisfied immediately
because of the unavailability of a link or when the link manager is in the
process of requesting a link.
% WAIT Percentage of requests for a link (based on REQ CNT) that the LINKMON
process or ACS subsystem processes queue when one or more other
requests are already queued for the server class.
For example:
A TCP sends 100 requests to a serverclass. It had
to queue 10 of them because no link was
immediately available.
For two of the 10 queued requests, there was
already at least one entry in the queue when the
new entry was to be queued.
In this case, the Queue Info %Wait will be
20%(2/10), not 10% (10/100) or 2% (2/100)."
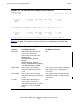
MAX WAITS The maximum number of link requests that were queued in a link manager
at any point.
AVG WAITS How many requests were waiting, on average, during the sample period
% DYNAMIC Percentage of requests for a link (based on REQ CNT) that the LINKMON
process or ACS subsystem processes received and resulted into a dynamic
link.