
TS/MP System Management Manual (H06.05+, J06.03+)


Tuning Your System by Using Statistics
HP NonStop TS/MP System Management Manual—541819-007
7-7
Frequency Distribution
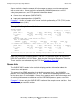
Table 7-3 shows the response time statistics and what they indicate.
If the number for STAND DEV is large in comparison to the number for AVG RESP, you
should review your application to determine the cause.
These are the limits imposed on measurement collection:
•
Measurements will stop for any server upon the 99,999,999th measurement.
•
Any measurement greater than 99,999,999.99 seconds is discarded.
•
Once a measurement counter reaches 99,999,999.99 seconds, measurements will
stop being collected for this server.
•
Response times are rounded to the nearest hundredth of a second.
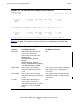
Frequency Distribution
When you specify the FREQTABLE option of the STATS SERVER command, the
PATHMON process displays supplemental statistics on the completion of SCREEN
COBOL SEND statements within a given time interval. These statistics are collected
only if your environment includes the Pathway/iTS product.
The supplemental information is contained in the frequency distribution table, as shown
in Example 7-5. A separate frequency distribution table is generated for each server
class.
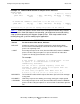
Table 7-3. Server Statistics for Response Time
Statistic Indicates
# MEAS Total number of collected measurements
AVG RESP Average response time calculated from the collected measurements
MAX RESP Maximum response time recorded during the given time interval (since
statistics were turned on or reset)
MIN RESP Minimum response time recorded during the given time interval (since
statistics were turned on or reset)
STAND DEV Standard deviation calculated from the collected measurements