
TS/MP System Management Manual (H06.05+, J06.03+)


Tuning Your System by Using Statistics
HP NonStop TS/MP System Management Manual—541819-007
7-8
Frequency Distribution
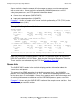
Table 7-4 on page 7-8 shows the server statistics for frequency distribution and what
they indicate.
You can use the statistics for frequency distribution to determine the times of peak load
for your system. The example in Example 7-5
shows a bimodal distribution with one
peak almost 20 times as long as the other. This is an indication that some system level
tuning might be required.
The frequency distribution table is not generated if either of these are true:
Example 7-5. Sample Server Statistics With Frequency Distribution Table
SERVER SERVME
IN TCP TCP1* 19 FEB 1996, 15:26:14
QUEUE INFO*: REQ CNT % WAIT MAX WAITS AVG WAITS % DYNAMIC
33710 99.8 7 2.38 99.9
I/O INFO*: REQ CNT MAX TSIZE AVG TSIZE I/O CNT
SEND 33740 2 2 33740
REPLY 2 2
RESPONSE TIME INFO (TIME VALUES IN SECS)*:
SEND TO SERVERCLASS
SUMMARY # MEAS AVG RESP MAX RESP MIN RESP STAND DEV
33739 0.50 2.51 0.01 0.49
FREQUENCY DISTRIBUTION*:
TIME INTERVAL (0.05 SECS) # MEAS CUM %
TI01 < 0.01 132 0.3
0.01 <= TI02 < 0.05 16720 49.9
0.05 <= TI03 < 0.11 5 49.9
0.11 <= TI04 < 0.17 1 49.9
0.17 <= TI05 < 0.22 9 49.9
0.22 <= TI06 < 0.28 0 49.9
0.28 <= TI07 < 0.34 0 49.9
0.34 <= TI08 < 0.39 1 49.9
0.39 <= TI09 < 0.45 1 49.9
0.45 <= TI10 < 0.51 0 49.9
0.51 <= TI11 < 0.56 0 49.9
0.56 <= TI12 < 0.62 0 49.9
0.62 <= TI13 < 0.68 0 49.9
0.68 <= TI14 < 0.73 0 49.9
0.73 <= TI15 < 0.79 0 49.9
0.79 <= TI16 < 0.85 0 49.9
0.85 <= TI17 < 0.90 0 49.9
0.90 <= TI18 < 0.96 0 49.9
0.96 <= TI19 < 1.02 16472 98.8
1.02 <= TI20 398 100.0
*Collected only if you have the Pathway/iTS product and TCP STATS ON
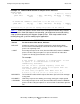
Table 7-4. Server Statistics for Frequency Distribution
Statistic Indicates
TIME INTERVAL Value of the time increment from one interval to the next
# MEAS Total number of measurements collected during the given time interval
CUM % Cumulative percentage of the total number of measurements the line
item represents