
BEA WebLogic Server Tuning Guide


26
low memory situations and force Garbage collection on a server. The following attributes of the server element
(configured in the Servers->Configuration->Memory Tab in the WebLogic Server Console are used for controlling
the thresholds. The attributes under this tab control how often WebLogic Server samples JVM memory and what is
the threshold at which WebLogic Server will force a Garbage collection. The default settings sample the JVM every
hour and force a garbage collection if the free memory reaches 5% of the free memory when the WebLogic Server
instance started. Moreover, when a garbage collection is in progress, the JVM is blocked from performing any other
work. So, a good tradeoff must be achieved between the frequency and garbage collection runs.
Note that this is in addition to normal garbage collection runs initiated by the JVM when low memory situations are
hit during the course of the operation of the JVM.
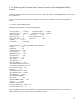
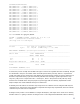
We recommend the following values for the parameters related to memory configuration:
GC Threshold : 5
GC Threshold: 5
Sample size: 10
Sampling frequency: <varies>
During the initial sampling of application memory requirements, we recommend that the sampling frequency be set
to a low value (for example, 6 minutes). Then, during a one hour steady state run, it can be determined whether the
configured memory on the server is enough. The output from the -verbosegc JVM option can be studied along
with the output from the WebLogic Server monitoring to arrive at the optimal memory configuration for an
application.
5.6 Using the WebLogic Server Console to Monitor the Performance of an
Application
WebLogic Server provides runtime information for monitoring all the WebLogic Server managed components. These
can be viewed graphically using the WebLogic Server console or can be queried from a performance monitoring
application using JMX facilities. Several key attributes relating to performance, like throughput, memory usage,
transaction rate, etc. can be monitored using these attributes. The Server->Monitoring tab provides various subtopics
to monitor these attributes.
5.7 Tuning the Java Heap
The Java VM used by WLS 8.1 SP3 on NonStop (NSJ 4) is based on the Sun HotSpot compiler server VM
implementation. This is significantly different from the NSJ 3.1 JVM which was based on the classic VM
implementation. An overview of the HotSpot JVM is available at http://java.sun.com/products/hotspot/whitepaper.html.
Not all of the GC mechanisms are available on the NonStop implementation (primarily because of a lack of
applicability to the NonStop environment). Refer to the NonStop Server for Java Reference Pages for unsupported
heap flags. Primarily, parallel GC and concurrent garbage collectors are not available on the NonStop server and
any facilities that depend on these are also not supported.
There are several options with respect to Heap management and tuning and tracing. The most common option is
–verbose:gc which prints garbage collection details (as in prior JVM releases). However, there are several more
heap tuning and tracing options in the HotSpot-based JVM.
One of the significant enhancements in the HotSpot compiler VM is the garbage collection mechanism. Tuning the
Java heap is an art by itself in the Hotspot environment. Another whitepaper that deals with this is available from
http://java.sun.com/docs/hotspot/gc1.4.2/. Even though this whitepaper is targeted to J2SE platform version 1.4.2,
many of the key concepts also apply to the 1.4.1 J2SE platform. (For additional reading, there is also a document
targeted towards the J2SE 1.3.1 HotSpot JVM available at http://java.sun.com/docs/hotspot/gc/.)